Observations from Store Glacier supports basalt melt model

The Greenland Ice Sheet is melting from the bottom up, caused in part by energy convection from melt water within the ice. An idea partly coined by researchers at GEUS and now supported by first field observations.


The effect of meltwater descending from the surface of the ice sheet down to the bed – a kilometre or more below – is by far the largest heat source beneath the world’s second-largest ice sheet, leading to phenomenally high rates of melting at its base.

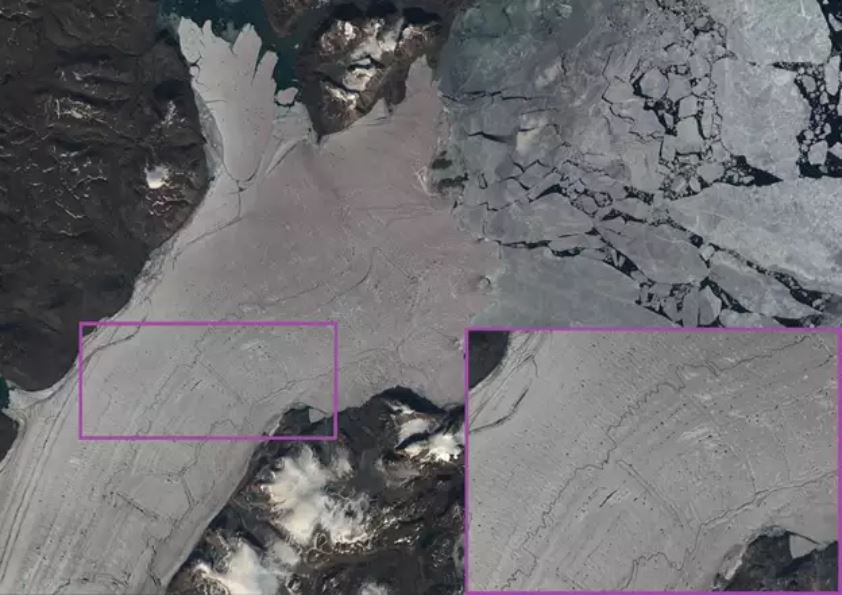
This finding was just published in a paper in Proceedings of the National Academy of Sciences by an international team of scientists, led by the University of Cambridge and with a co-author from the Geological Survey of Denmark and Greenland (GEUS). Based on observations from a top-to-bottom ice fracture and adjacent boreholes at Store Glacier in Western Greenland, the team calculated that as much as 82 million cubic metres of meltwater was transferred to the bed of Store Glacier every day during the summer of 2014 (the work took place over seven years).

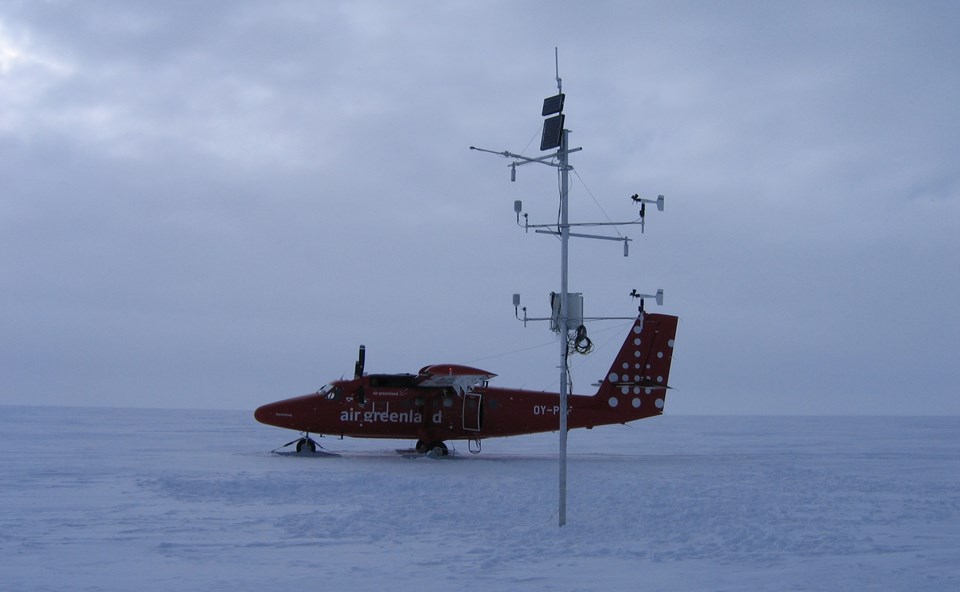
The observed basal melt rates were often as high as the melt rates measured on the surface with a weather station. At the base, the researchers found the temperature of water to be as high as +0.88 degrees Celsius, which is unexpectedly warm for an ice sheet base with a melting point of -0.40 degrees. A significant amount of this heating was traced to the water, releasing kinetic energy when hitting the ground.

Water flowing into a crevasse (moulin) and down to the bed of Store Glacier. Credit: Poul Christoffersen

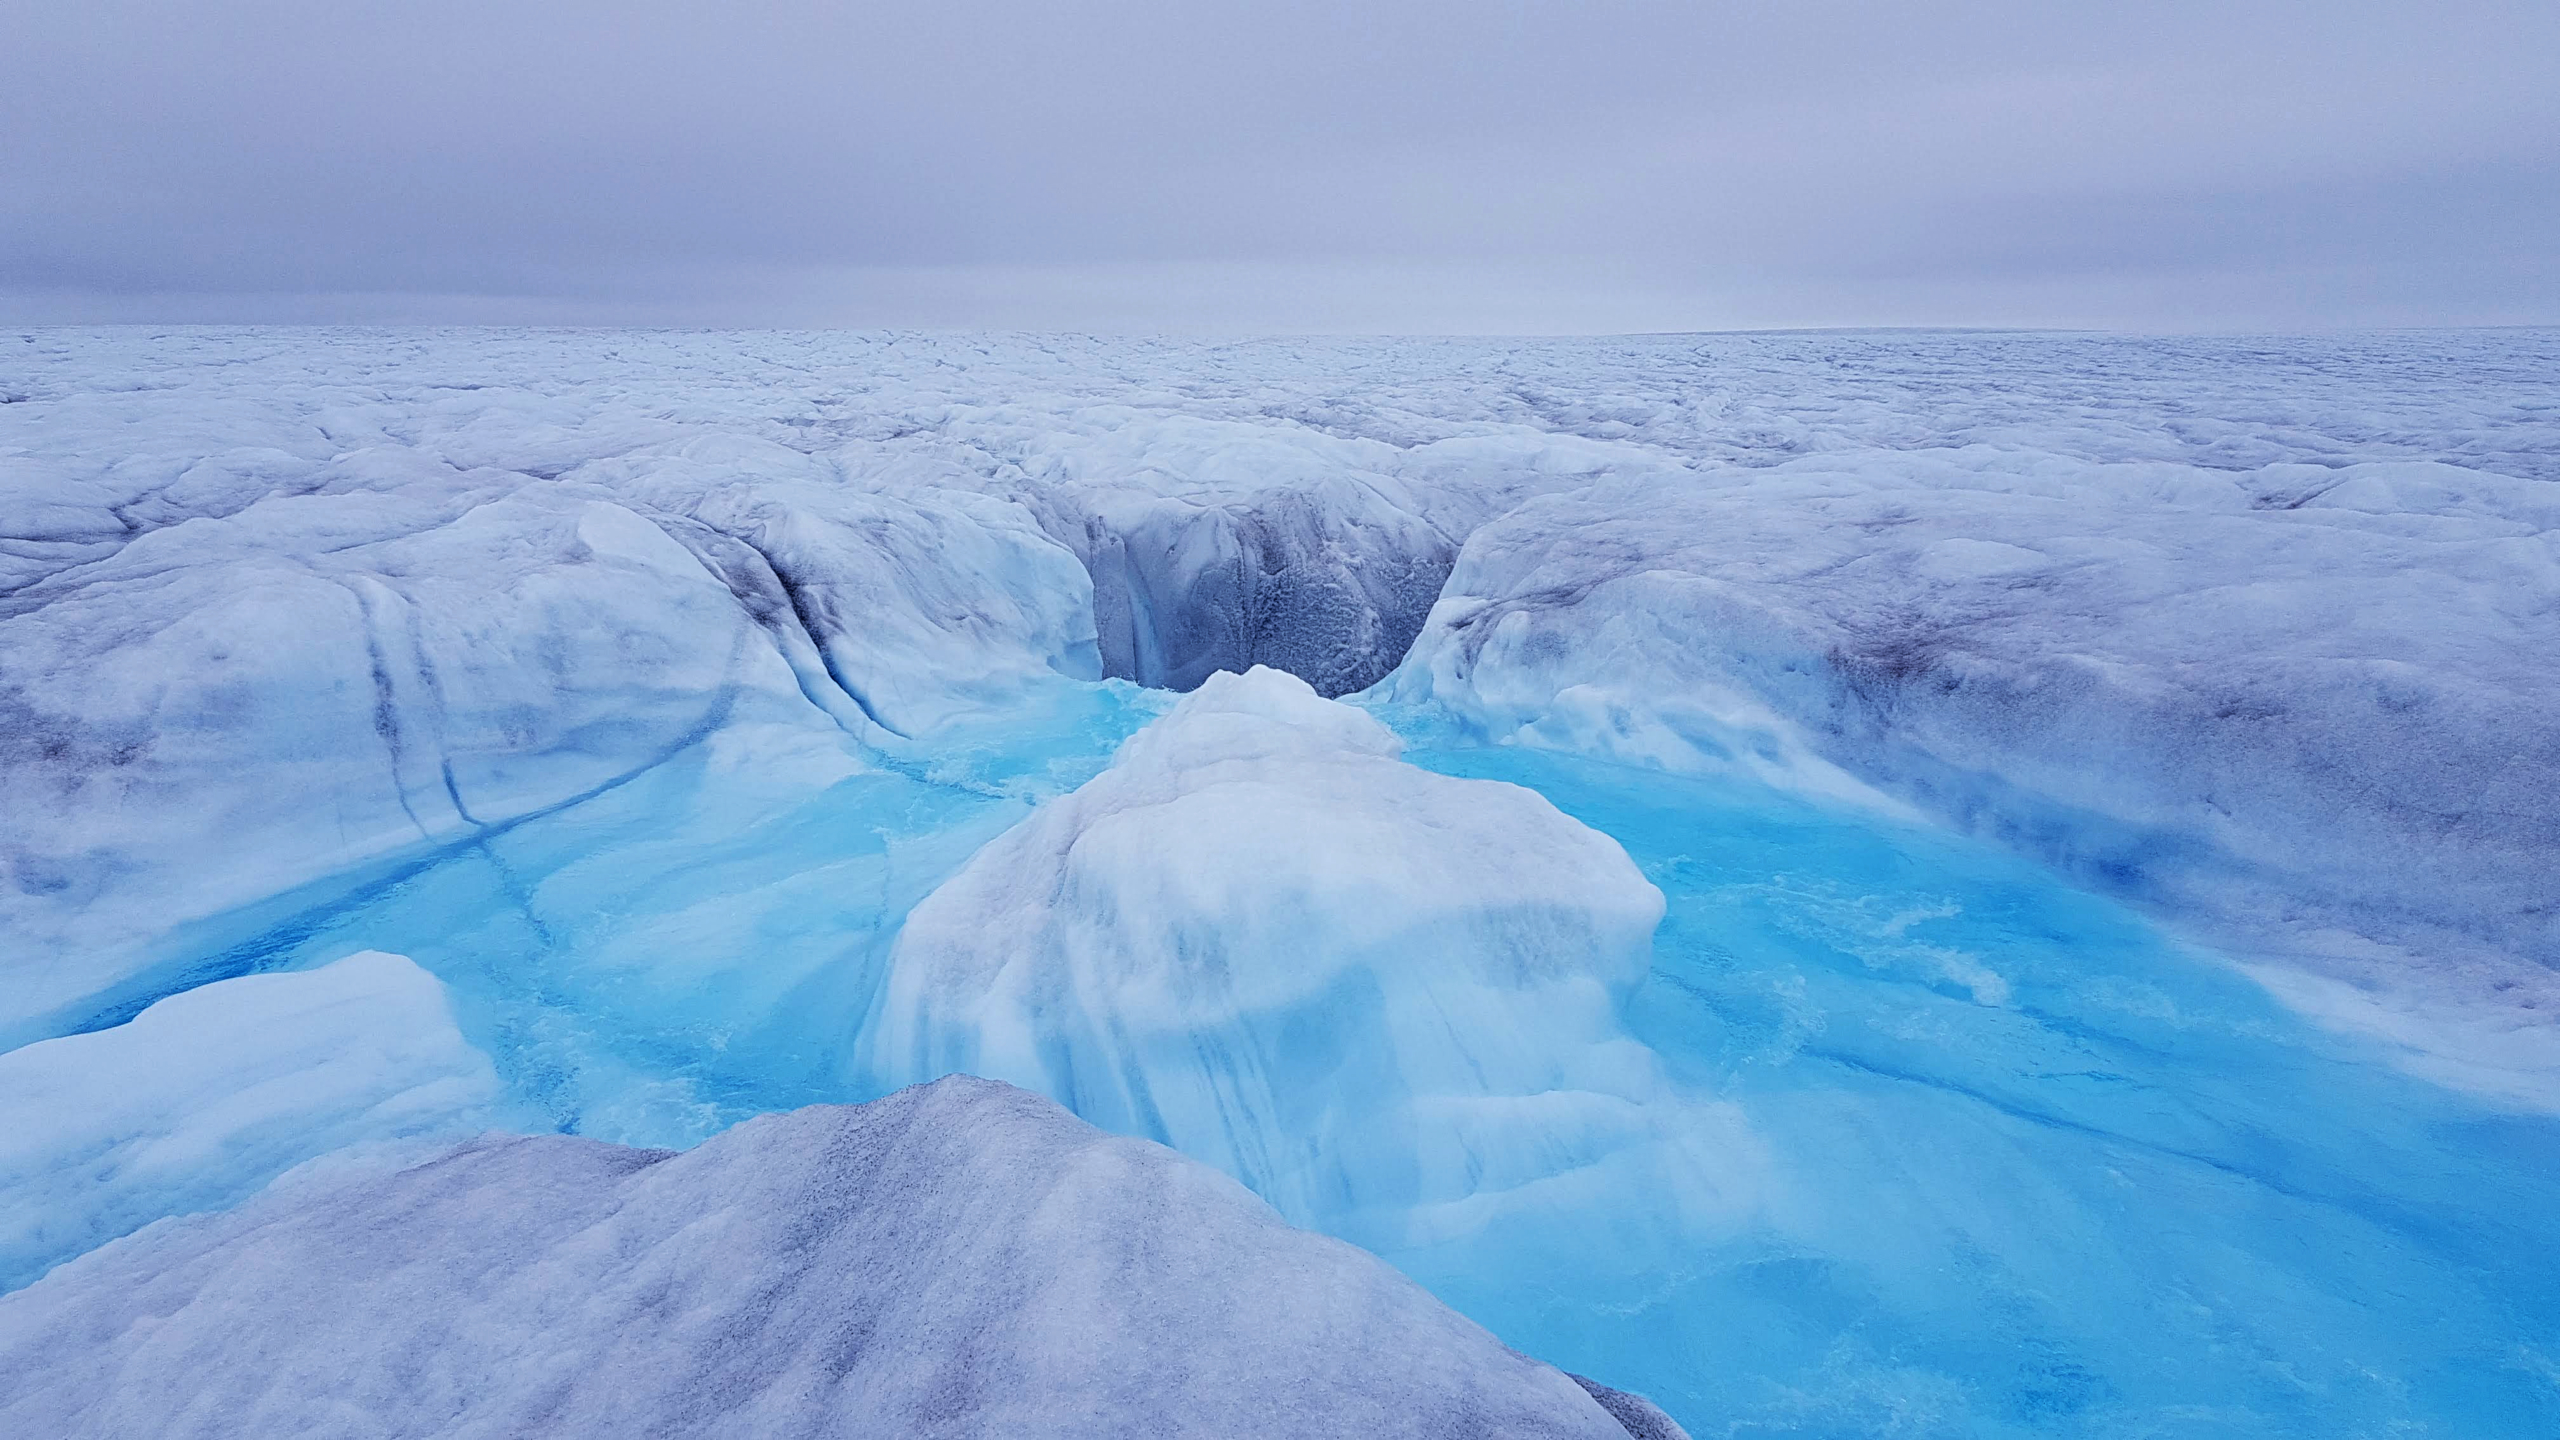
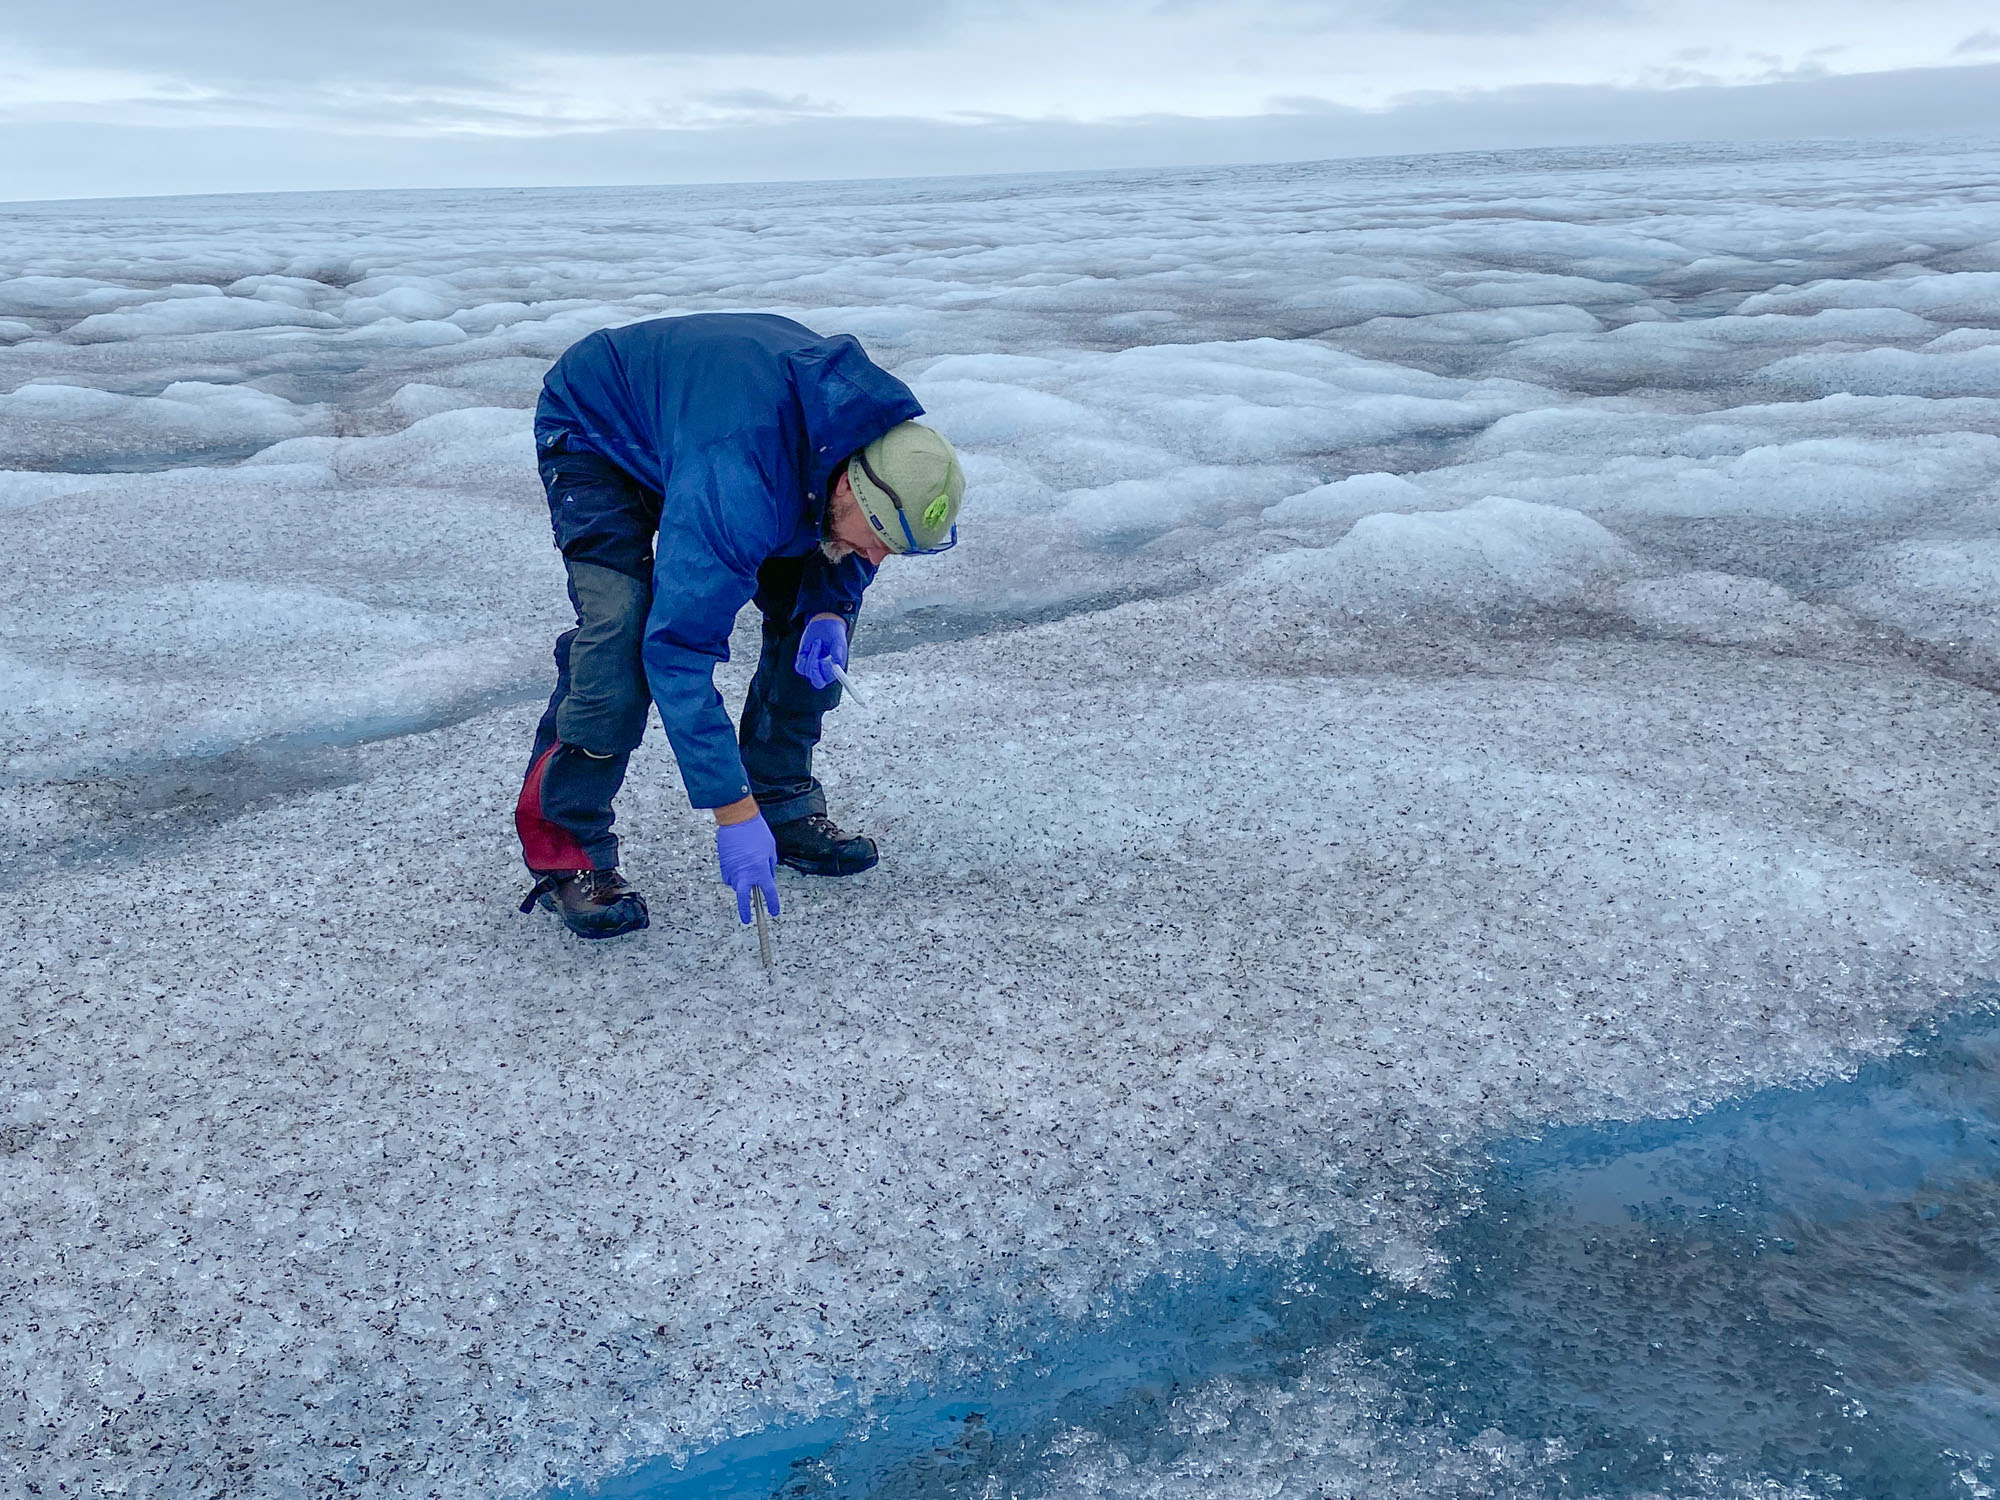
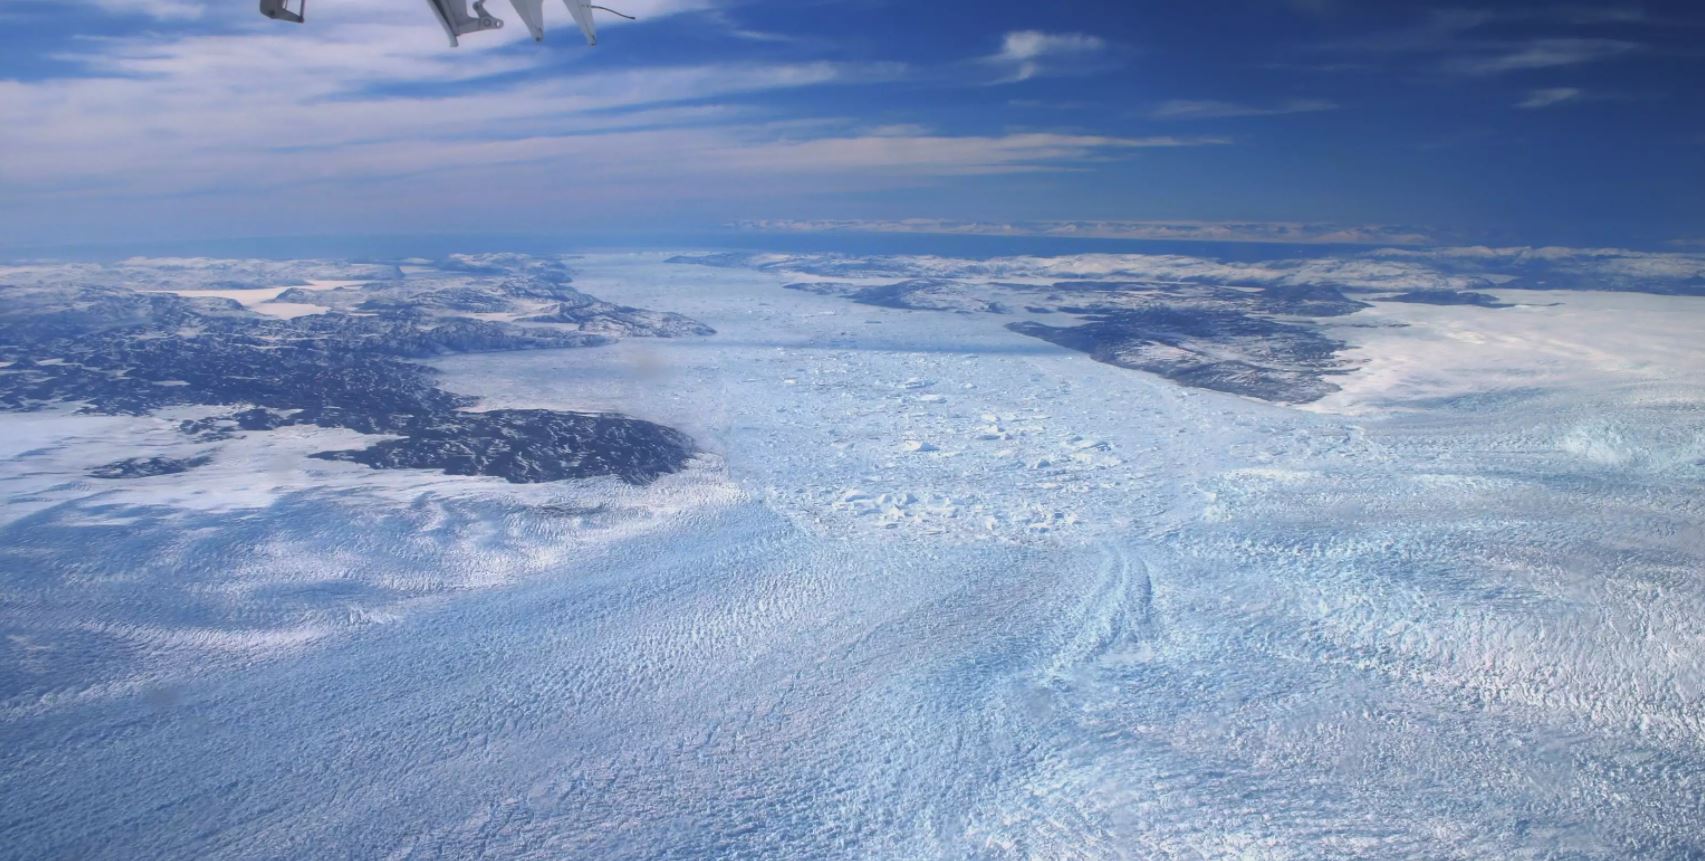
Meltwater flowing into a fracture (called a moulin) and down to the bed of Store Glacier. (Credit: Poul Christoffersen)

Supports model estimates

Senior researcher Kenneth Mankoff from the Department of Glaciology and Climate at the Geological Survey of Denmark and Greenland (GEUS) co-authored the study, which supports similar Ice Sheet-wide estimations put forth by himself and a University of Santa Cruz-colleague in 2017 (Mankoff & Tulaczyk 2017) and in extended form by GEUS-colleagues in 2021 (Karlsson et al. 2021).

“In the current study, I ran the new data through our Ice Sheet-wide model and helped put the observations from Store Glacier into a larger context. To put it a bit backwards, our model supports the observations,” says Kenneth Mankoff. He adds:

“This is the first actual observations of basal melt factors made on the Ice Sheet, and it’s good to see a very good fit with our overall estimate for the entire Ice Sheet.”

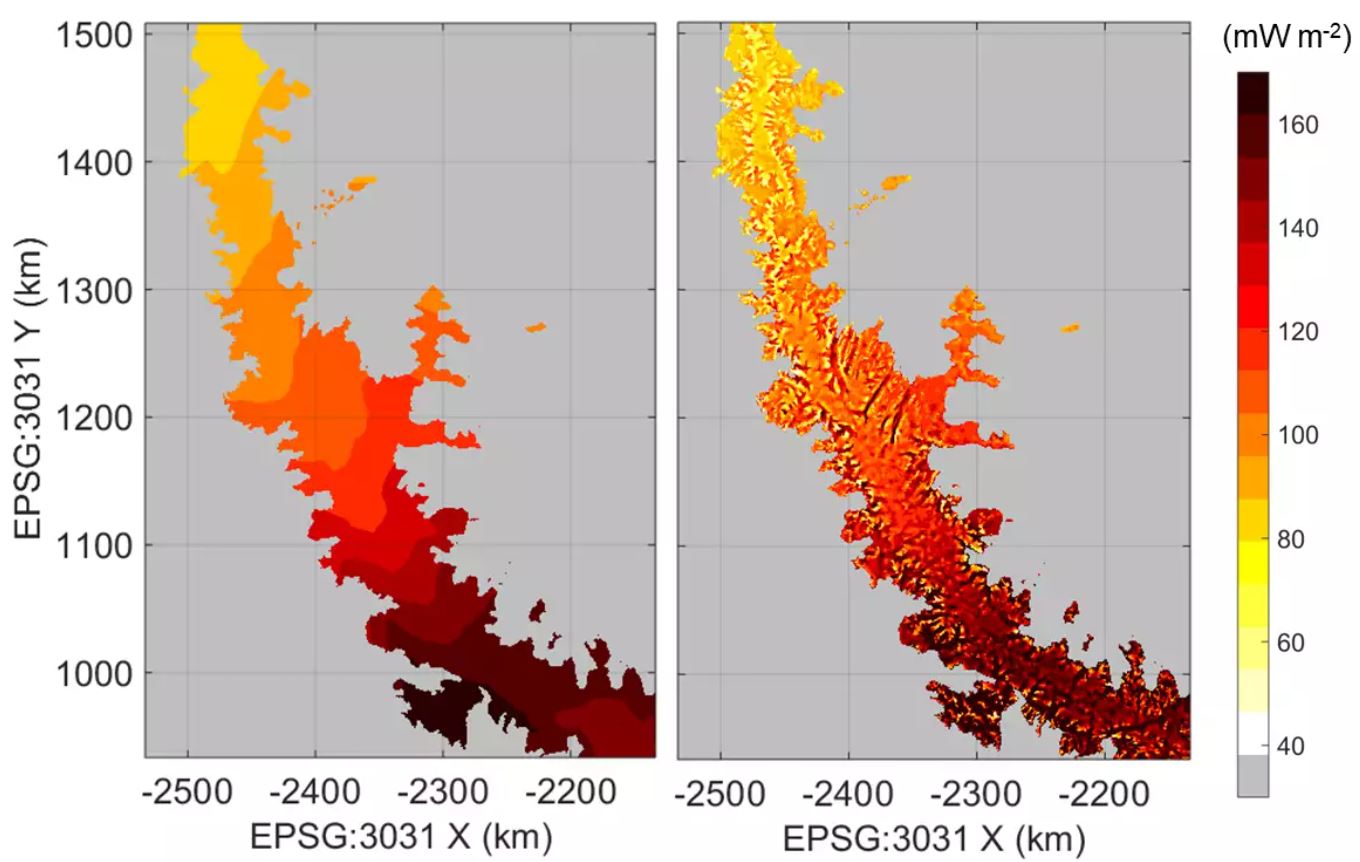
In the previous study from 2021, published in Nature Communications, Karlsson et al., it was estimated that around 8 percent of the mass loss from the ice sheet came from basal melt caused by a combination of friction between the ice and the ground, geothermal heating and – the focus of the present study – heating from energy convection from meltwater falling from the surface.

bassal melt factors, credit GEUS

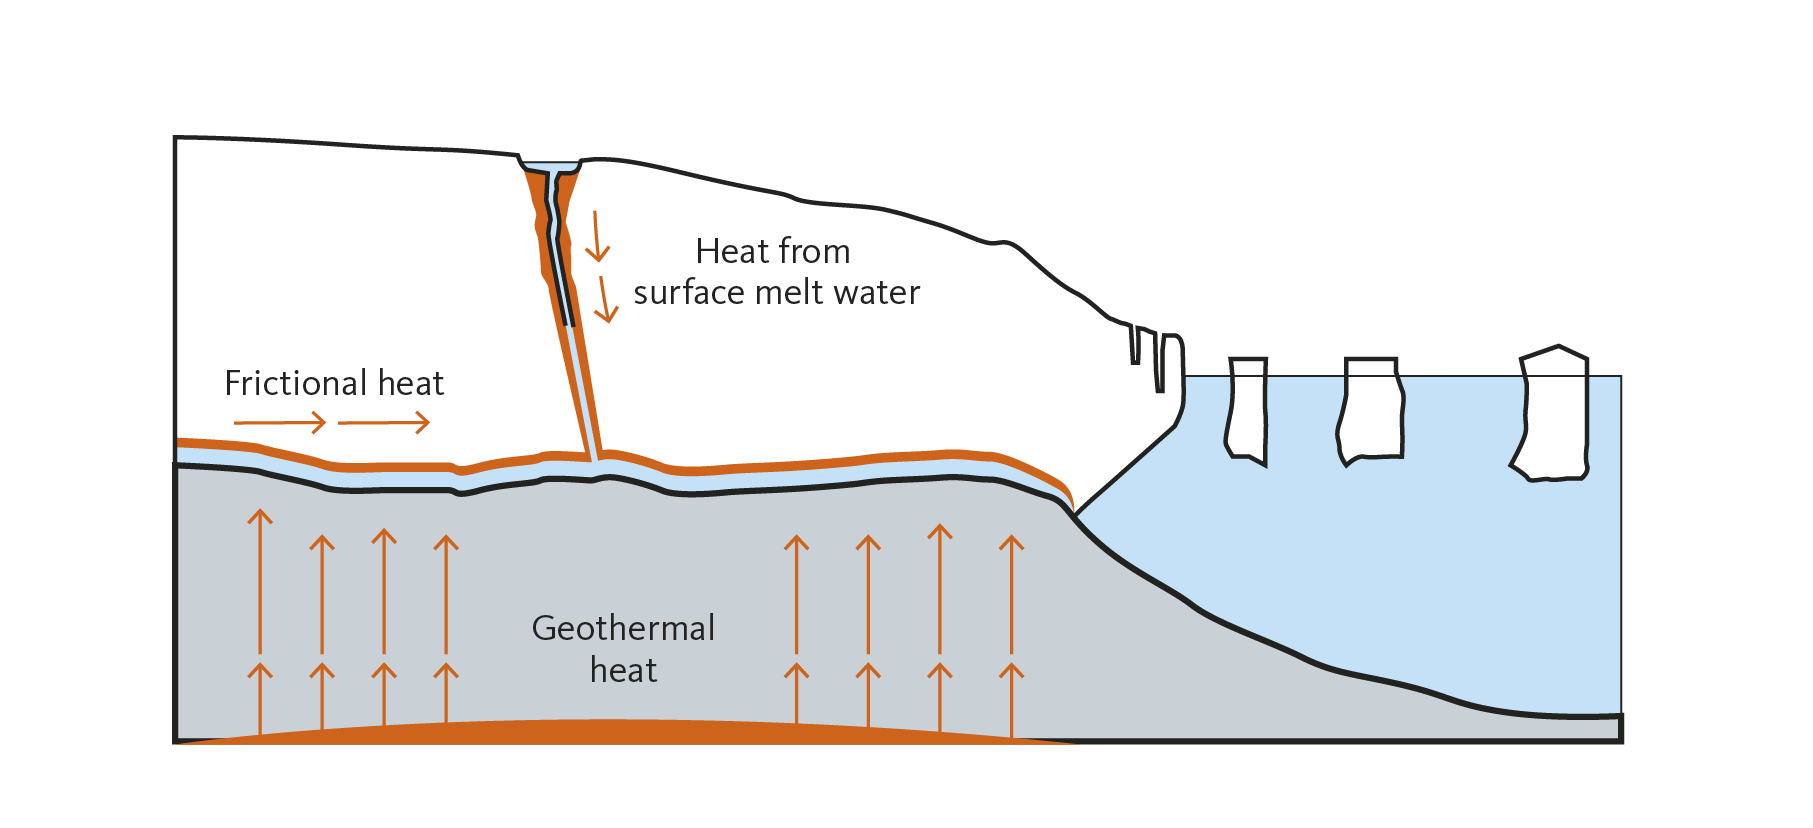
The factors contributing to basal melt of the Greenland Ice Sheet and its glaciers. Credit: Jacob Lindt Bendtsen, GEUS

Journal announces PROMICE paper as ‘most read’ in 2021

The scientific journal GEUS Bulletin just announced the most popular publications of 2021 and a paper with three PROMICE researchers are at the top.


A scientific paper with authors from the PROMICE team just made the top of ‘2021 most read and downloaded’ publications in the scientific journal GEUS Bulletin.

The publication ‘Greenland bare-ice albedo from PROMICE automatic weather station measurements and Sentinel-3 satellite observations’ features an overview of changing bare-ice area of Greenland and the snow and ice darkness in two extreme years of 2018 and 2019.

From publication in April 2021, the paper was downloaded 936 times and had 1,398 abstract views. Which is several hundred downloads ahead of second place Svennevig et al. with ‘Preliminary landslide mapping in Denmark indicates an underestimated geohazard’.

Editor congratulates researchers

GEUS Bulletin editor in chief Catherine Jex congratulates the researchers saying: “The number of downloads achieved by this paper is super for a journal like GEUS Bulletin.” She adds that the visibility achieved by all the top papers sets a new high standard for the journal, which has undergone numerous upgrades.

One of the authors of the top ranking paper, Professor Jason Box from The Geological Survey of Denmark and Greenland (GEUS) department of Glaciology and Climate and part of the PROMICE research team thinks the popularity stems from specific factors that support one another.

“The article was popular because for one: the changes to the bare ice area of Greenland is not widely reported but is where most melting happens. Another second factor is, this was the first study featuring Greenland-wide bare ice area results from a new EU satellite mission (Sentinel-3). A third factor is how the PROMICE network is reaching a level of maturity, now with 15 years of data, that we can make more definitive statements as to what is really happening to the ice”

As described in the abstract, the researchers used “105 PROMICE ice-melt time series to identify the timing of seasonal bare-ice onset preceded by snow cover conditions.” The result was applied to “snow-to-ice albedo transition value to measure the variations in daily Greenland bare-ice area in Sentinel-3 optical satellite imagery covering the extremely low and high respective melt years of 2018 and 2019.”


Illustration, bare-ice in 2018 and 2019, copyright GEUS Bulletin

Monthly averaged Greenland snow and ice albedo from Sentinel-3 OLCI data in July 2018 and 2019. Inset figures: Time series of Greenland ice-sheet albedo and bare-ice area over 2018 and 2019 melt seasons (1 May and 15 September). Wehrlé et al. 2021, GEUS Bulletin


Authors, Wehrlé et al:

  • Adrien Wehrlé Geological Survey of Denmark and Greenland (GEUS), Copenhagen, Denmark
  • Jason E. Box Geological Survey of Denmark and Greenland (GEUS), Copenhagen, Denmark
  • Masashi Niwano Meteorological Research Institute, Japan Meteorological Agency, Tsukuba, Japan
  • Alexandre M. Anesio Department of Environmental Science, Aarhus University, Roskilde, Denmark
  • Robert S. Fausto Geological Survey of Denmark and Greenland (GEUS), Copenhagen, Denmark

Algae blooms: “I never saw the ice as dark as this”

GEUS and PROMICE professor Jason Box recently made the front page in Danish national media with testimony of algal blooms and rain on the Greenland ice sheet. PROMICE field work helps quantify the ice algae blooms and their effect on melting.


Autumn 2021, Professor Jason Box and two PROMICE colleagues landed on what could appear to be tarmac during a field trip to a glacier near Narsaq in the Southwest of Greenland. However, the dark surface was in fact glacier ice hit by a heavy bloom of algae adapted to ice surfaces, called ice algae.

Recently the story was picked up by one of Denmark’s major newspapers, Politiken, who ran it as front cover just before New Year’s Eve of 2021. In the article, Jason Box explained how the algae blooms makes the ice darker causing it to absorb more sunlight and thus melt faster.

“I never saw the ice as dark as this. It was a surprise and made me concerned,” Jason Box said to Politiken, adding that where the ice algae grow particularly well, they can speed up melting of the surface ice by as much as 20 percent.

See albedo data for the location here:

PROMICE climate station recordings of surface darkness (a.k.a. albedo) for 2021 compared to the average since 2008. Melt season 2021 albedo was at or near the lowest on record for more than three months (June through mid-September). The cause is thought to be from persistent cloudy and rainy conditions that promoted ice algae growth. In May however, snowfall caused the albedo to increase shortly before decreasing during the summer melt season. (Illustration: PROMICE)


PROMICE helps collect algae data

These years the algal growth on the Greenland Ice Sheet is on the rise, which Professor Box and other PROMICE and GC-Net researchers have helped quantify. Since much of the research done by the team require travelling all over the ice sheet every year, they are starting a new PROMICE activity “PROM-BIO” in collaboration with Aarhus University Professor Alexander Anesio.

The work supports ice algae research by collecting biological samples from the ice from places that would otherwise be difficult to reach for other researchers.

Jason Box collecting samples from the alge bloom seen as dark spots on the ice. Photo: GEUS

This helps other researchers understand the development and biology of ice algae with some emphasis on the dark ice relationship with melting which in turn helps PROMICE and GC-Net understand how the darkening ice surface effect the overall mass balance of the ice sheet.

“Ice algae have started to colonize larger parts of Greenland. They’ve become an x-factor in the melting process,” Box said in the Politiken article.

Unprecedented rainfall

Along with the algae blooms, 2021 was also the year of the first ever witnessed rain falling on the highest and coldest areas of the ice sheet. An event also measured by PROMICE and GC-Net automated weather stations.

As Professor Box explains in Politiken, he and the rest of the researchers studying ice and climate dynamics in the Arctic constantly find new factors driving the melt of the ice sheet:

“Algae blooms existed before humanity. One could observe dark ice in Greenland 200 years ago as well, but what we see now is that the heating of the Earth allows for many different factors to enhance each other. We have several climate models predicting a warming, but reality surprises us over and over because the models haven’t taken all of the contributing factors into account.”

Therefore, the work done by PROMICE and GC-Net becomes all the more important, trying to understand all of these factors effecting each other and enhancing the melt.

Updated PROMICE model shows mass balance 24/7

Every type of loss and influx of ice and snow on the Greenland Ice Sheet has now been gathered in one model, a so-called input/output-model, which provides scientists worldwide with the best information about what is actually happening with the large ice area in the north.

It’s clear to everyone, that the Greenland Ice Sheet is melting, but exactly how much? And by exactly which processes? The Programme for Monitoring the Greenland Ice Sheet (PROMICE) has the answer with updates now coming in near real time. The team behind PROMICE just published an updated model offering the latest update on the mass balance of the Ice Sheet including new data and observations. All of which is described in a paper recently published in Earth System Science Data.

New data includes the fact, that approximately eight per cent of the melting from the Greenland Ice Sheet actually takes place from the bottom and inside the ice (called basal melt). Information also quantified in a paper from the PROMICE research group published in Nature Communications in June 2021. This had not been quantified before, and the information has up until now not been a part of most climate models used to predict the impact of the melting regionally and globally.

”This does not change the melting estimate but is gives us a much better picture of how the ice is melting and why. Many other models only show that there is general melting and no more than that,” says Ken Mankoff, who is one of the PROMICE researchers running the surveillance programme on the Greenland Ice sheet.

”Obtaining a better understanding of exactly where and how the ice melts and the involved processes makes it easier to understand the changes we observe over time. By doing so, our modelling of the future changes will be more accurate,” he adds.

Real time and open data

He explains that the new calculation of the basal melt is one of the updates, which has now made the PROMICE surveillance model one of the most advanced. That is to say that the PROMICE data set:

  • Is the only one of its kind (input/output-model) that includes basal melt and runs in real time. This makes it much easier to track changes when they happen, and not the following year.
  • Is fully available to the public.
  • Gives researchers an insight into the individual factors of the model and not just an overall result showing how much has melted. With the PROMICE models you can see precisely where the ice has melted, whether it is from the glaciers, a single glacier, a single region, east/west etc.

These factors make it easier for researchers not only at GEUS but all over to monitor the pulse of ‘the patient’ 24/7.

Predicts melting through next week

Apart from the basal melt data, the PROMICE model incorporates a string of other data.

  • Satellite measurements
  • Aerial photos
  • Measurements of snow, temperature, albedo etc. on the ice
  • Climate models
  • Computer models and simulations

The data set that the PROMICE researchers have pieced together goes all the way back to 1840 and ‘all the way to next week’ as Ken Mankoff says.

”Our model gives a pretty good estimate of snow and ice influx and loss one week into the future. This is based on all the data it contains about ice reaction patterns in the past combined with the present weather and climate prognoses etc.”

Amongst other things he has made a graph that constantly and in real time updates how much ice melts or is added. You can see it below or the automated original placed at Twitter here.

Graph: The red graph depicts mass balance in the present melt season (September through September). Black graphs depict mass balance in previous years. (Mankoff. et al.2021).

Read the paper

The paper ‘Greenland ice sheet mass balance from 1840 through next week‘ published by Earth Science System Data is open access.

Get the data

All data from PROMICE can be accessed here.

PROMICE weather data now fully transparent

The Programme for Monitoring the Greenland Ice Sheet has published a full description of calculations, code and models behind the automatic weather stations located in the ice sheet making it easier for researchers all over to incorporate the information.

A PROMICE automatic weather station (UPE_U) photographed on 4 August 2018. The numbers shown in the figure denote the following: 1 – radiometer; 2 – inclinometer; 3 – satellite antenna; 4 – anemometer; 5 – sonic rangers; 6 – hygro-/thermometer (aspirated); 7 – pressure transducer; 8 – solar panel; 9 – data logger, multiplexer, barometer, satellite modem, and GPS antenna; 10 – battery box; 11 – thermistor string (eight levels)

When doing research in glaciology, climatology, oceanography and so on it’s crucial to obtain the best possible information to base your calculations on. For years the Programme for Monitoring of the Greenland Ice Sheet (PROMICE) has made these data widely available regarding the ice sheet dynamics and mass balance. Many of which is based on meta data from an array of automatic weather stations placed around the ice sheet. Now, the PROMICE team have published all the calculations and assumptions behind the data from these weather stations as well. Making the data services derived from them fully transparent for other scientists.

”This has taken a lot of work to do, but now we have written a guide to how all these data services are done so that, in principle, everybody could replicate them. Which hopefully makes it easier for other scientists to incorporate our data,” says Robert S. Fausto who is chief scientist of PROMICE.

Basically, up until now you’ve been able to order the food on the menu, but now you get full access to all the recipes so you can make the dishes at home as well.

Important milestone

The data services derived from the weather stations include everything from temperature or humidity on the ice sheet measured every ten minutes to snow fall, ablation, short and long wave radiation and much more. All the stuff you need to do research in the above mentioned fields. Amongst others.

According to the chief scientist, it’s taken over a decade to get all the different equipment and models up and running to a point where it’s bug free and more or less automated.

“So this is a very important milestone for PROMICE,” Robert S. Fausto says.

Read the paper

The data description paper ‘Programme for Monitoring of the Greenland Ice Sheet (PROMICE) automatic weather station data’ is published in the journal Earth System Science Data.

Find it here

Get the data

All data from PROMICE can be accessed here.

Further information

Senior Researcher, Robert Schjøtt Fausto
Glaciology and Climate
Email: [email protected]
Tel.: +45 91333838

Monitoring the Greenland Ice Sheet ”as close to real-time as possible”

Now anyone can see how quickly the ice that forms the Greenland Ice Sheet is moving, as new data roll in approximately every other week. This provides researchers all over the world with the best opportunities to discover and predict changes in the enormous, northernly mass of ice.

The Greenland Ice Sheet is not still – it moves from the middle and out towards the edges. It is faster in the summer when there is a lot of melting, but the velocity can be affected by many different factors all year round. Changes in this velocity is valuable knowledge if you want to predict the effect of climate change on the enormous mass of ice.

Recently, PROMICE published a ‘free for all’ ice velocity map of the entire Greenland Ice Sheet with data that are updated every 12 days and have a spatial resolution of 500 x 500 metres. This may make glaciological studies much easier.

”The maps are free and can be downloaded by everyone with set time intervals. This provides researchers worldwide with a much better opportunity to follow what happens to the Greenland Ice Sheet while it happens, which is a huge advantage when you work with something that is so dynamic,” says Anne Munck Solgaard, Project Manager on the velocity map project and researcher at GEUS’ Department of Glaciology and Climate. She was one of the researchers who started the project back in 2016, and together with colleagues at DTU Space she has worked on optimising and collecting the correct data necessary to make the map ever since.

”It has taken time to set up a system that can collect and process the terabytes of data we need to make the velocity maps. Now, we have a more or less operational set-up and the majority of the work runs automatically,” she says.

Discovering the behavioural pattern of the glaciers

The frequently updated maps in high resolution makes it possible to study the individual parts of the ice as well as the whole in much greater detail than before.

”Now we can get a much better idea of what happens both to the individual glaciers and the whole Greenland Ice Sheet, not just during a season but over several years,” says Anne Munck Solgaard.

”I think it’s pretty amazing that I can sit here in my office and see it all in such great detail – almost watching it happen.”

Amongst other things, the maps make it possible to discover the ’secret life’ of the glaciers, as the researcher says. Using the very frequent data sets dating all the way back to the project launch in 2016, the researchers can analyse the ‘behaviour’ of all the glaciers during the year and under different weather conditions etc. We can learn much more about how glaciers work and interact with the climate when we are able to observe them in detail over time. And the same goes for the Greenland Ice Sheet.

”We can make much more detailed analyses and projections of the mass loss of the Greenland Ice Sheet over time, and this in turns gives us a much better picture of how much the ice contributes to sea level rise for instance.”

And the map has already been used in several studies, says Anne Munck Solgaard, both in GEUS’ own glaciological department and by other researchers. As she says, different groups of researchers have made maps before, but until now, none have been updated as frequently and as regularly.

As fast as it gets

Although 12 days sounds like a lot and not particularly like ’real-time’, it is as fast as it gets right now according to Anne Munck Solgaard. The two satellites, from which the researchers collect the data, fly over the same place on the Greenland Ice Sheet and record data every 12 days – 6 days staggered. In order to get the best map, data from the two satellites are combined and then the two sets of data are processed by a powerful computer and quality checked before a new map is produced.

This is incredibly good compared to just a few years ago, says the researcher.

”Even in 2014, a velocity map of the Greenland Ice Sheet was not something you had access to the way we have today. Previously, no-one acquired these amounts of data above the Greenland Ice Sheet, and the data were not easily accessible by all. It was a breakthrough when data from the newly launched ESA Sentinel satellites as well as from the American Landsat satellite were made free for all.”

Therefore, researchers only got an indication of how the ice was moving, since the velocity very much depends on the season and can change a lot from one year to the next.

”The PROMICE velocity map makes it possible to follow the ice dynamic as close to real-time as it is possible right now, and this gives us a much better opportunity to discover and examine changes and differences from one year to the next or from one month to the next,” she says.

Always room for improvement

Of course, there is still room for improvement. Amongst other things the research team would like to add one more measurement so that the velocity can be measured even more precisely:

”We would like to include a method called InSAR in our setup. Right now, the maps are made using a method called offset tracking, which works really well in the areas where the ice moves quickly. The other method exploits another part of the data and works well in the inner parts of the Greenland Ice Sheet where the ice moves slowly. By combining the two, we get the best picture of reality,” says Anne Munck Solgaard.

How the map is made

  • Radar data of Greenland are acquired from The European Space Agency (ESA)’s two Sentinel 1 satellites.
  • All data are processed, the many singular parts are gathered into one map and ‘noise’ is taken into consideration.
  • Uncertainties are frequently checked by comparing data with measurements from PROMICE measuring stations in different places on the Greenland Ice Sheet.
  • Data are quality checked manually and a new map is generated and put online: https://dataverse01.geus.dk/dataverse/Ice_velocity.

Aarhus University, Denmark, heads large-scale joint arctic efforts in the danish realm

By Peter Bondo

Under the name GIOS – Greenland Integrated Observing System – the Danish Realm will bring the collection of data into a completely new era. The project runs until the end of 2025 when a new research infrastructure must be in place and ready to provide measurements of changes in air, ice, land and the sea in the Arctic for many years to come. GIOS has a total budget of about DKK 80 million.

Coordinated efforts

Greenland plays a unique and central role in the global climate system, and it also covers all existing climate gradients in the Arctic. It is therefore crucial for the entire world to understand the changes that are taking place in Greenland in order to better predict the effect of the global climate change.

“We are very pleased with the grant from the Ministry of Higher Education and Science. It boosts collaboration between all Arctic research environments within the Danish Realm and ensures that it plays a leading role in international Arctic research and thus has a crucial Arctic voice in the international debate,” says Rector Brian Bech Nielsen, Aarhus University.

The joint project is an extension of the so-called Hindsgavl Initiative, where the Arctic stakeholders of the Danish Realm have discussed the necessity of combining the expertise across all institutions in order to describe the mechanisms behind the climate changes in the Arctic and to strengthen the interaction with international partners.


Photo 1: During the GIOS project, automated measurement stations will be established in and around Greenland to monitor changes in the atmosphere, on the inland ice, on land, in lakes, rivers, fjords and in the sea. Some of the measurement stations will be established in mobile containers that can be moved from one location to the other. The stations will all be connected to wind turbines and solar cells, allowing measurement and transmission of data via satellite all year-round. Here is a measurement station situated on the inland ice near Tasiilaq, East Greenland. Photo Andreas Ahlstrom


Automated measurement stations

GIOS will develop and establish a network of automated measurement stations in and around Greenland. Measuring equipment will monitor conditions in the atmosphere, on the inland ice, on land, in lakes, rivers and fjords, and measurement buoys will log measurements of physical, chemical and biological conditions in the sea. Airborne sensors will record snow depths and the thickness of the sea ice and thus supplement fixed road stations, which, among other things, measure meteorological and geomagnetic conditions as well as the atmospheric content of greenhouse gases.

“The measurement stations will act as hubs from where the data is transmitted quickly to all interested parties all over the world,” says Professor Søren Rysgaard, head of the Arctic Research Centre, Aarhus University, and coordinator of the GIOS project.

“The new GIOS initiative will provide us with a far better data basis for understanding the rapid changes in the Arctic. It will also provide input to international models and, in this way, give us a better understanding of how the current changes in and around Greenland affect the global climate and living conditions for people, animals and plants,” says Søren Rysgaard.

To ensure the least possible climate imprint of the extensive activities, the measurement stations will be connected to solar cells, wind turbines and a larger rechargeable battery capacity, allowing collection of data all year round.


Photo 2: An automated measurement station established at the research station Zackenberg in North-East Greenland. Photo: Marcin Jackovicz-Korczynski.


All the players on the team

The GIOS collaboration includes Greenland Institute of Natural Resources, Aarhus University, University of Copenhagen, Technical University of Denmark, GEUS, ASIAQ Greenland Survey, Aalborg University, DMI, the Joint Arctic Command, University of Southern Denmark, Greenland’s National Museum & Archive, National Museum of Denmark, University of Greenland and Havstoven on the Faroe Islands.


Photo 3: Within the framework of the GIOS project, a number of easily manageable and cheap measurement buoys will be installed; the buoys move up and down in the sea and transmit data via satellites when they are at the surface. Here one of the buoys is tested outside Ella Island in East Greenland. Photo: Lucas Sandby.


Further information

Project coordinator, Professor Søren Rysgaard, Centre Director of the Arctic Research Centre, Aarhus University.

Email: [email protected];

Tel.: + 45 2464 3206.

Study presents new view on geothermal heat flow in Greenland and Antarctica

Researchers from The Geological Survey of Denmark and Greenland (GEUS), University of Colorado, NASA, John Hopkins University, University of Maryland, University of California and University of Alaska have developed a new method to account for variations in geothermal heat flow caused by sub-glacial bed topography under the Greenland and Antarctic ice sheets.


View over the deeply incised glacier Jakobshavn Isbræ. Photo: William Colgan


Presently, there is a lot of uncertainty about the magnitude and pattern of geothermal heat flow beneath the Greenland and Antarctic ice sheets, and models do not account for variable bed topography.

In a newly published study led by GEUS, researchers have developed a statistical method for correcting geothermal heat flow models to make them consistent with known subglacial bed topography.


Heat flow is stronger within glacier valleys

It has been known for over a century that geothermal heat flow is greater in valleys and smaller on ridges. In this new study, the researchers have examined the effect of the ice-sheet bed’s topographic relief on geothermal heat flow to generate the first comprehensive snapshot of changes in geothermal heat flow at scales of hundreds of meters. They found that geothermal heat flow in several regions—most notably central East Greenland and the Antarctic Peninsula—is routinely doubled within glacier valleys and correspondingly halved along ridges.

“Basically, if the heat escaping Earth’s interior is looking for the quickest way to radiate into the atmosphere, a deeply incised valley provides the fastest exit. This effect is readily observable from the fact that geotherms – surfaces of constant temperature – are packed more closely together beneath valleys, indicating a stronger temperature gradient there – and hence heat flow – in comparison to ridges,” says William Colgan, Senior Researcher in the Department for Glaciology and Climate at GEUS and lead author of the new study.


Geothermal heat flow can change drastically across hundreds of meters

The researchers behind the study created a simple statistical model to estimate this topographic influence on geothermal heat flow and applied it to digital elevation models of the sub-glacial topography beneath the Greenland and Antarctic ice sheets. The result was a much more detailed geothermal heat flow map than what is usually seen.

“We are showing that instead of being something that changes gradually across tens of kilometers, geothermal heat flow can change drastically across hundreds of meters. This might really change how people think about variations in geothermal heat flow, not only beneath the ice sheets, but also other regions on Earth where there is a lot of topographic relief,” says study co-author Yasmina Martos of NASA and the University of Maryland.


Improved ice-flow predictions

According to Colgan, knowing the temperature distribution within the ice sheets is essential for creating accurate ice flow models.

“If you run a computer simulation of an ice sheet with a severe over- or under-estimation of the geothermal heat flow, you can easily end up generating an ice sheet that is either too warm or too cold. Ice flow is very sensitive to temperature – particularly near the bed – so geothermal heat flow is a critical variable for simulating the form and flow of Earth’s ice sheets,” Colgan explains.

The researchers behind the study hope that these topographic corrections for geothermal heat flow will be adopted into present-day ice-flow models to improve ice-flow predictions.

The method can also be used to estimate the influence of topography on geothermal heat flux in non-ice covered areas. The researchers hope to next create a global model to account for the effect of topography on geothermal heat flow across the entire Earth.


Left: An existing regional geothermal heat flow model. Right: Regional geothermal heat flow corrected for local topographic relief.

GEUS takes over American climate stations on the Greenland ice sheet

The recently published Danish Finance Act allocates funds for The Geological Survey of Denmark and Greenland (GEUS) to continue the Greenland Climate Network (GC-Net) as part of a complete, future monitoring of the Greenland ice sheet.


GC-Net climate station.


Spread across the enormous middle of the Greenland ice sheet is a network consisting of 16 climate stations called the Greenland Climate Network (GC-Net), which was established in 1995 as part of NASA’s climate research programme. Due to reprioritisations in the US, the financing of GC-Net runs out by the end of 2020. Therefore, it has been decided that The Geological Survey of Denmark and Greenland (GEUS) will take over and maintain GC-Net in the future in collaboration with ASIAQ Greenland Survey.

“It makes a lot of sense to place the monitoring of the Greenland ice sheet within the Danish Commonwealth. It is the second largest ice mass in the world and now also the biggest contributor to sea level rise globally. So we have an obligation to monitor what happens to it,” says Andreas Ahlstrøm, new programme leader for the GC-Net and Chief Consultant in the Department for Glaciology and Climate at GEUS.


It takes 30 years to identify a climate trend

GC-Net is already a central part of the climate monitoring on the Greenland ice sheet where data from the climate stations, among other things, is used to validate satellite data and improve climate models of the ice sheet. In this type of research, scientists use so-called climate normals – i.e. an average of the weather over a 30 year period, which is necessary in order to say anything for certain about the development of the climate. And according to Jason Box, new research leader for the GC-Net and research professor in the Department for Glaciology and Climate at GEUS, this is another important reason why GC-net should continue.

“By supporting a series of short term science studies, the US enabled my (recently late) mentor Konrad Steffen to sustain the GC-Net for more than two decades. Now Denmark is carrying the torch forward as we are approaching 30 years of observations – the period of time key to separating the year to year ‘noise’ from the climate trend,” says Jason Box, who has worked in GEUS since 2013, and who made most maintenance of the GC-net from its beginning and the first 11 years.


GC-Net and PROMICE provide a complete overview of the condition of the ice sheet

GEUS already runs the Programme for Monitoring of the Greenland Ice Sheet (PROMICE), which is also a network of climate stations. But as opposed to GC-Net, PROMICE’s climate stations are placed on the edge of the ice sheet where they monitor the amount of melt, the climate, the movement of the ice and the loss of ice from the calving glaciers in Greenland. And according to Robert Fausto, project manager for PROMICE and Senior Researcher in the Department for Glaciology and Climate at GEUS, it is extremely important that both PROMICE and GC-Net exist.

“The combination of GC-Net and PROMICE enables us to say something about the total mass balance of the ice sheet – meaning how much snow is falling on the middle of the ice sheet to balance the loss from melt and glaciers. We need both networks of climate stations to get a complete picture of how the climate affects the Greenland ice sheet,” says Robert Fausto.

GEUS takes over GC-Net at the beginning of 2021. There will then be a transition period, which will be used to determine how the collaboration with PROMICE is going to be and what the research infrastructure is going to look like in the future.

Data from both PROMICE and GC-Net will continue to be freely available to the international research community. See the data from PROMICE here.

Glacier disintegration at the Arctic’s largest remaining ice shelf

The Arctic’s largest ice shelf has detached a 113 km2 area. The last few years have been incredibly warm in northeast Greenland and this appears to be a progressive disintegration.


The red area in the optical satellite image shows the ice lost the past two years from the part of the Nioghalvfjerdsfjorden Glacier called Spalte Glacier that calves into Djimphna Sund. An area of 113 km2 has been lost. Source: Copernicus Sentinel data modified by GEUS.

Annual end-of-melt-season area changes for the Arctic’s largest ice shelf in Northeast Greenland are measured from optical satellite imagery, and it shows that the area losses for the past two years (year 2018/2019 and year 2019/2020) both exceeded 50 km. In total an area nearly twice that of Manhattan Island, New York. In the survey period since 1999, the ice shelf has lost 160 km2.

“We should be very concerned about what appears to be progressive disintegration at the Arctic’s largest remaining ice shelf, because upstream it is the only major Greenland ice sheet ice stream, draining 16 % of the inland ice reservoir,” says Professor Jason Box from The Geological Survey of Denmark and Greenland (GEUS).

The Northeast Greenland Ice Stream extends 600 km into the interior of the ice sheet draining mainly through the two outlet glaciers Nioghalvfjerdsfjorden Glacier and Zachariae Glacier, when Zachariae lost its ice shelf, 2002-2015 followed by a large increase in ice loss by calving processes. Now, for two consecutive years, the ice shelf of Nioghalvfjerdsfjorden Glacier is disintegrating at similar rates.

Disintegration at the northern tributary of the Arctic’s largest remaining ice shelf showing disintegration at the Spalte glacier, northern tributary to the Nioghalvfjerdsfjorden Glacier with minor advance elsewhere. Source: EU Copernicus Sentinel-2B image S2B_MSIL1C_20200827T152809 modified by GEUS


Not surprising

Dr. Niels J. Korsgaard, researcher at The Geological Survey of Denmark and Greenland (GEUS), explains that when an ice shelf is reduced or completely collapses, resistance of ice flow to the ocean is also reduced making the glaciers accelerate and thin.

“When you observe large parts of an ice shelf breaking off you do raise an eyebrow, but with current developments in the Arctic there is also the realization that this is to be expected,” Niels J. Korsgaard says and continues:

“Temperatures in the Arctic are rising faster than the global average. More heat is available from air and ocean to melt away the bottom and surface of ice shelves, and the thinning ice shelves are more susceptible to breaking up. We saw this with Zachariae Glacier, this summer with Milne Ice Shelf in Canada, and now Nioghalvfjerdsfjorden Glacier is losing parts of its ice shelf as well.”


Source: Copernicus Sentinel data modified by GEUS.

Glacier Acceleration

Dr. Anne Solgaard, researcher at The Geological Survey of Denmark and Greenland (GEUS) explains that glacier velocities derived from a range of satellites shows a significant acceleration at the Nioghalvfjerdsfjorden Glacier over the past decade.

“Using almost 30 years of satellite data, we see speed up in the glacier flow over the past decade. It is not only near the current disintegration, but we measure acceleration 80 km upstream where the ice begins to float, indicating a large-scale change to this huge glacier,” says Anne Solgaard.


The climate connection

Dr Jenny Turton, researcher at FAU, Germany, who is investigating the impact of a changing climate on the glacier says:

“The last few years have been incredibly warm in northeast Greenland. We had very early melt onset in 2019 linked to the heatwave across Europe and Greenland.”

Observations from local PROMICE.dk weather stations indicate consistently above average air temperatures driving extended melt conditions the past two years.

PROMICE.dk automatic weather station recordings since 2008 indicate how 2019 and 2020 air temperatures have been above the previous 10 year average. Source: Promice.dk and GEUS

“The atmosphere in this region has warmed by approximately 3°C since 1980 and record-breaking temperatures have been observed in 2019 and 2020”, says Jenny Turton.

She explains that warmer summers mean even more melting of the glacier and ice sheet.

“Each summer, water drains from the Greenland ice sheet onto the tongue of the glacier, forming rivers and ponds on the surface. Refreezing of the water in winter creates additional pressure on the floating tongue, which can lead to calving events.”

The warm weather also means that the sea ice along the east coast of Greenland is breaking up and melting. Sea ice can form a barrier to hold back the glacier ice, so in years with less sea ice, calving can occur.

EU Copernicus Sentinel 2B satellite image from July 31st 2019 showing the pools and rivers of water (dark blue) on the surface of the Nioghalvfjerdsfjorden Glacier.