A much needed check-in with Greenland’s 20,000 ‘baby glaciers’

Greenland’s many small glaciers are melting at great speed, and the melting is increasing, especially in the Arctic regions where the warming is worst. Now, researchers have studied precisely how much mass these glaciers – not connected to the ice sheet – have lost in recent decades.


In the Arctic, temperatures are rising more than in the rest of the world, and this is causing the northernmost glaciers in Greenland to melt at record speed. This is shown in a new study by researchers from the Geological Survey of Denmark and Greenland (GEUS), DTU Space, NASA Goddard Space Flight Center, Utrecht University, University of Bristol and the University of Copenhagen.

The study focuses on smaller glaciers with no connection to the Greenland Ice Sheet. These peripheral glaciers make up only about four percent of Greenland’s ice-covered areas, corresponding to approximately the same area as Ireland (72,000 km2), but they contribute as much as 11 percent of the total loss of ice from Greenland’s ice-covered areas. Thus, they are a major contributor to global sea level rise.

“The loss of ice from these small glaciers occurs because they are more sensitive to ongoing temperature changes and therefore melt faster than we see in many other places in the Arctic,” says Professor Shfaqat Abbas Khan from DTU Space, who is the lead author of the paper just published in Geophysical Research Letters.

Unstable northern glaciers

The new study shows that the melting of the peripheral glaciers has increased dramatically over the past two decades. On average, 42.3 gigatons (billion tonnes) of ice melted per year from October 2018 to December 2021. In comparison, ‘only’ 27.2 gigatons melted annually in the period February 2003 to October 2009.

“We can see that there is a marked increase in the melting of the glaciers in northern Greenland. This shows that the ice masses in Greenland are very unstable and that they make a considerable contribution to the global sea level rise,” says Professor Shfaqat Abbas Khan.

“It is disturbing, but to be expected, that the northernmost ice sheet on the planet is hit hard by the ongoing temperature rises, because it is evident that the temperature here has also risen the most in the last 20 years.”

The changes have been recorded using altimetry (altitude measurements) with the American satellites ICESat and ICESat-2.

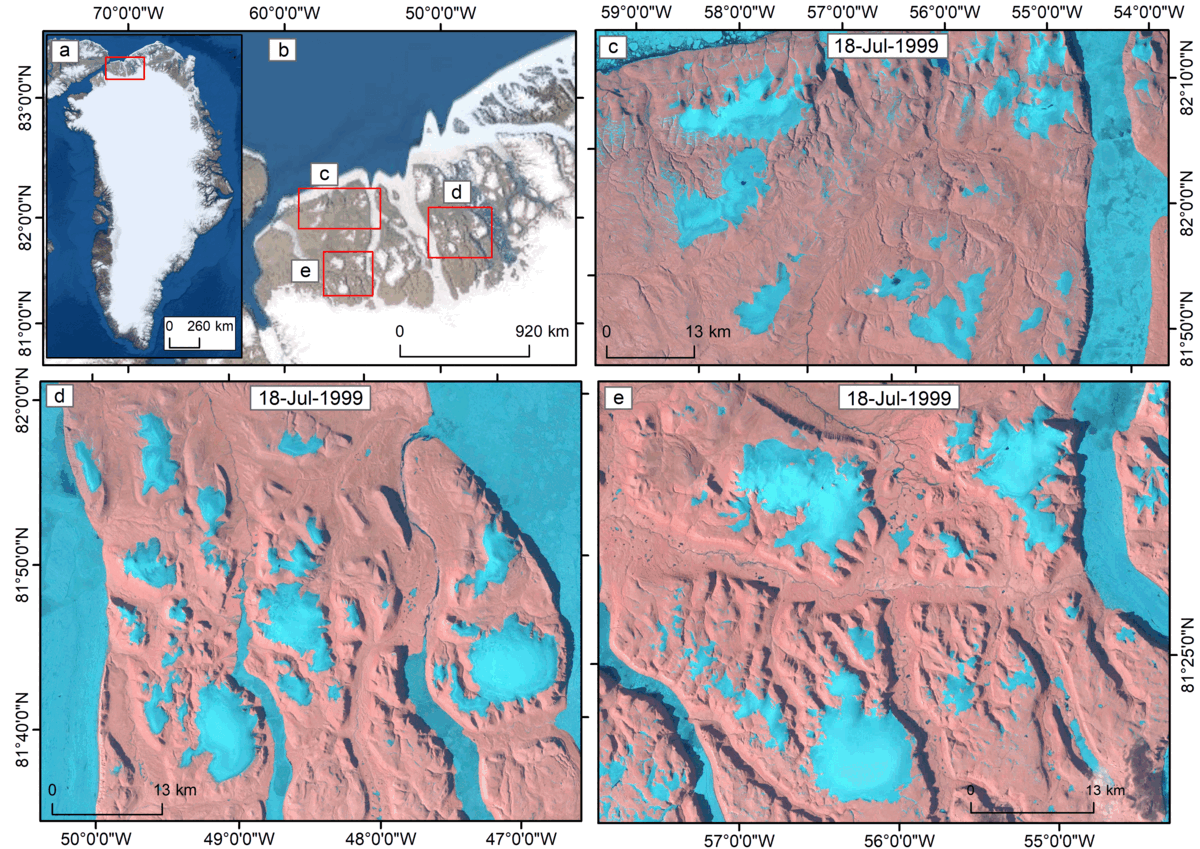
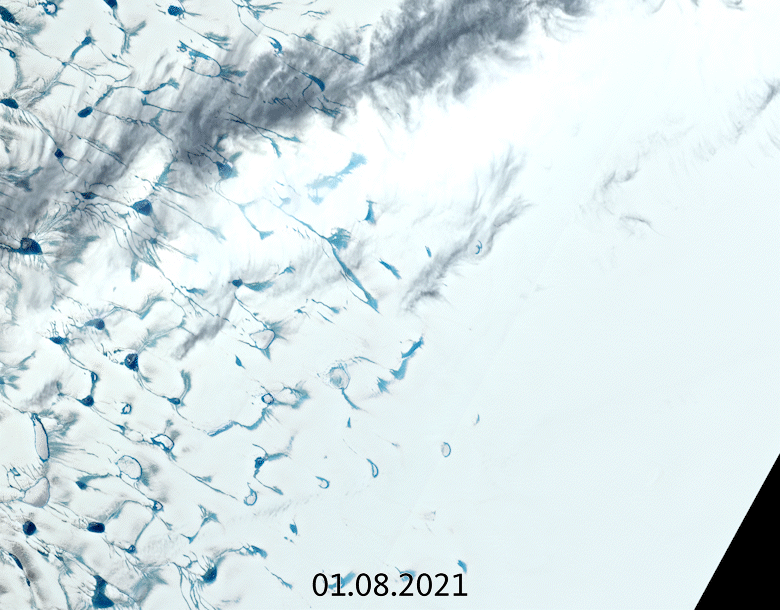
Illustration: Northern isolated glaciers diminishing visibly from July 1999 to July 2919, measured by satellite (Khan et al. 2022)

Variations in melting

Although the isolated glaciers are not part of the Greenland Ice Sheet, it is important to include them in the total melt budget from the Arctic in order to calculate exactly how much the region contributes to sea level rise.

Thus, it is important to keep track of all sources, especially because there are large variations in the melting patterns in different parts of Greenland, says Senior Researcher and co-author of the new study, William Colgan from the National Geological Survey of Denmark and Greenland (GEUS) Department of Glaciology and Climate.

“Many studies have documented the state of the Greenland Ice Sheet over the past decade. But even though the loss of ice from peripheral glaciers is such a large part of Greenland’s total ice loss, there are very few studies documenting the ‘health’ of these peripheral glaciers. In fact, ours is the first altitude measurement of Greenland’s peripheral glaciers with laser satellites since 2013,” he says.

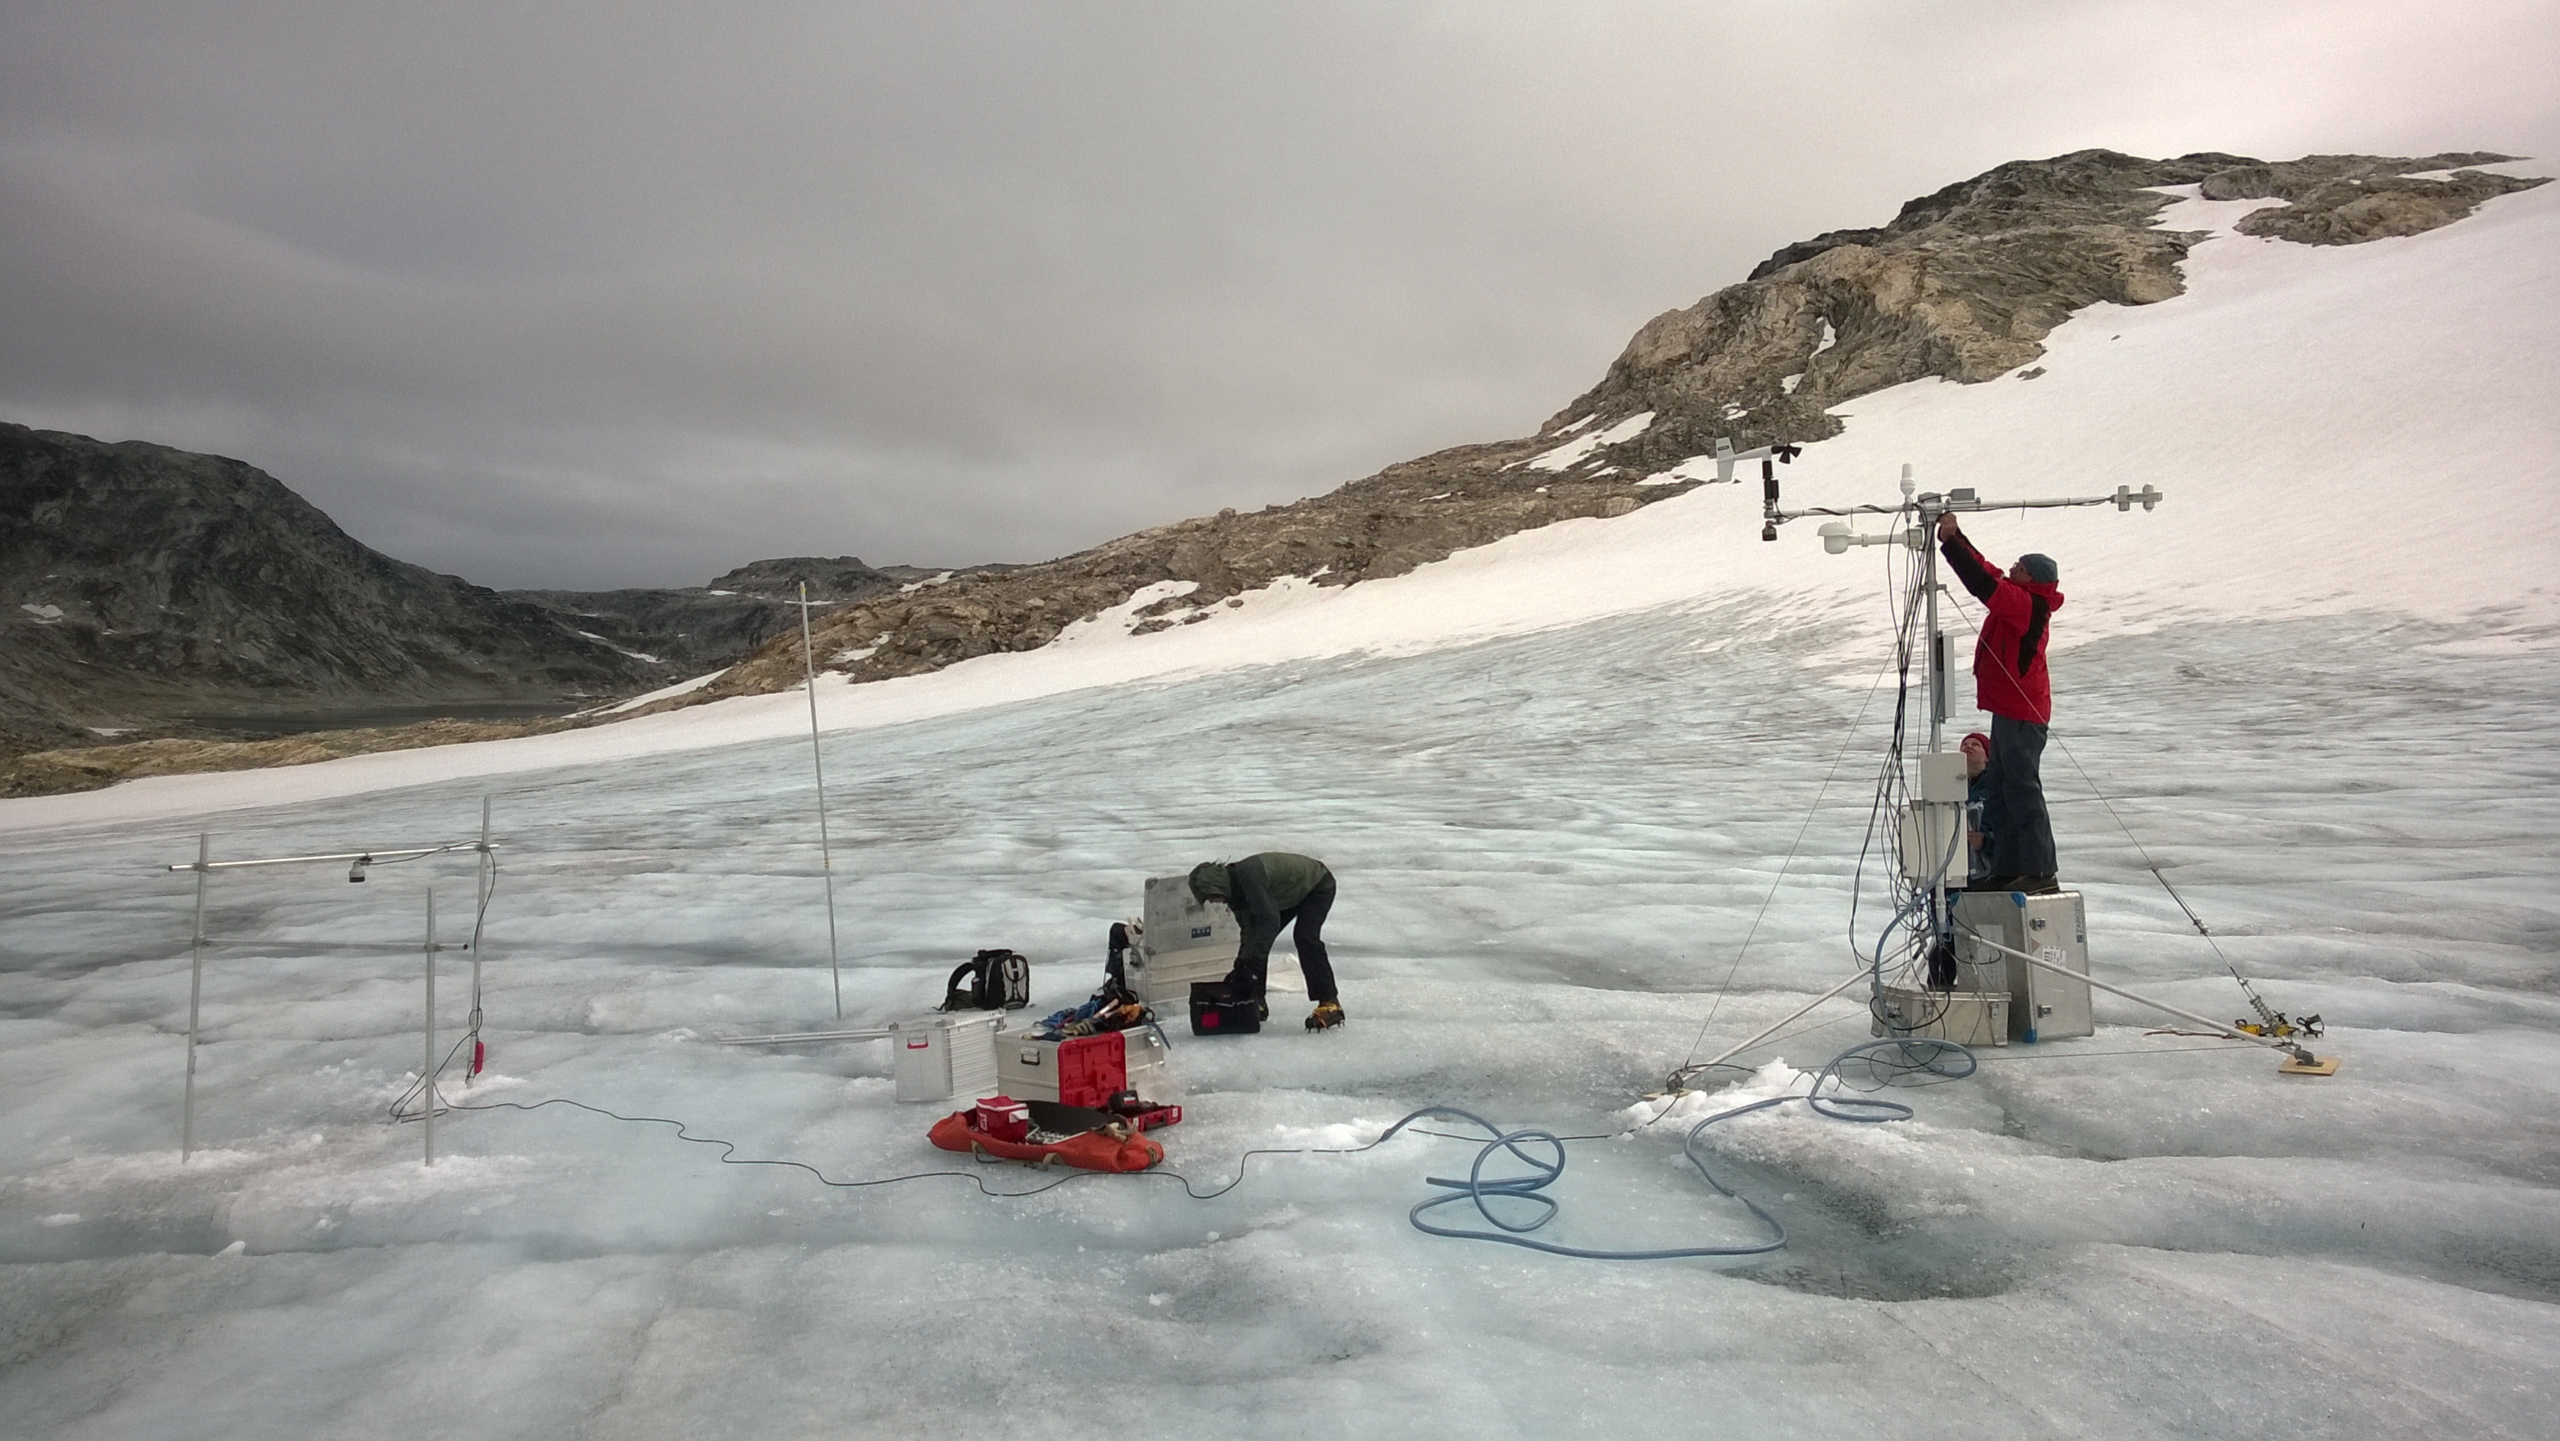
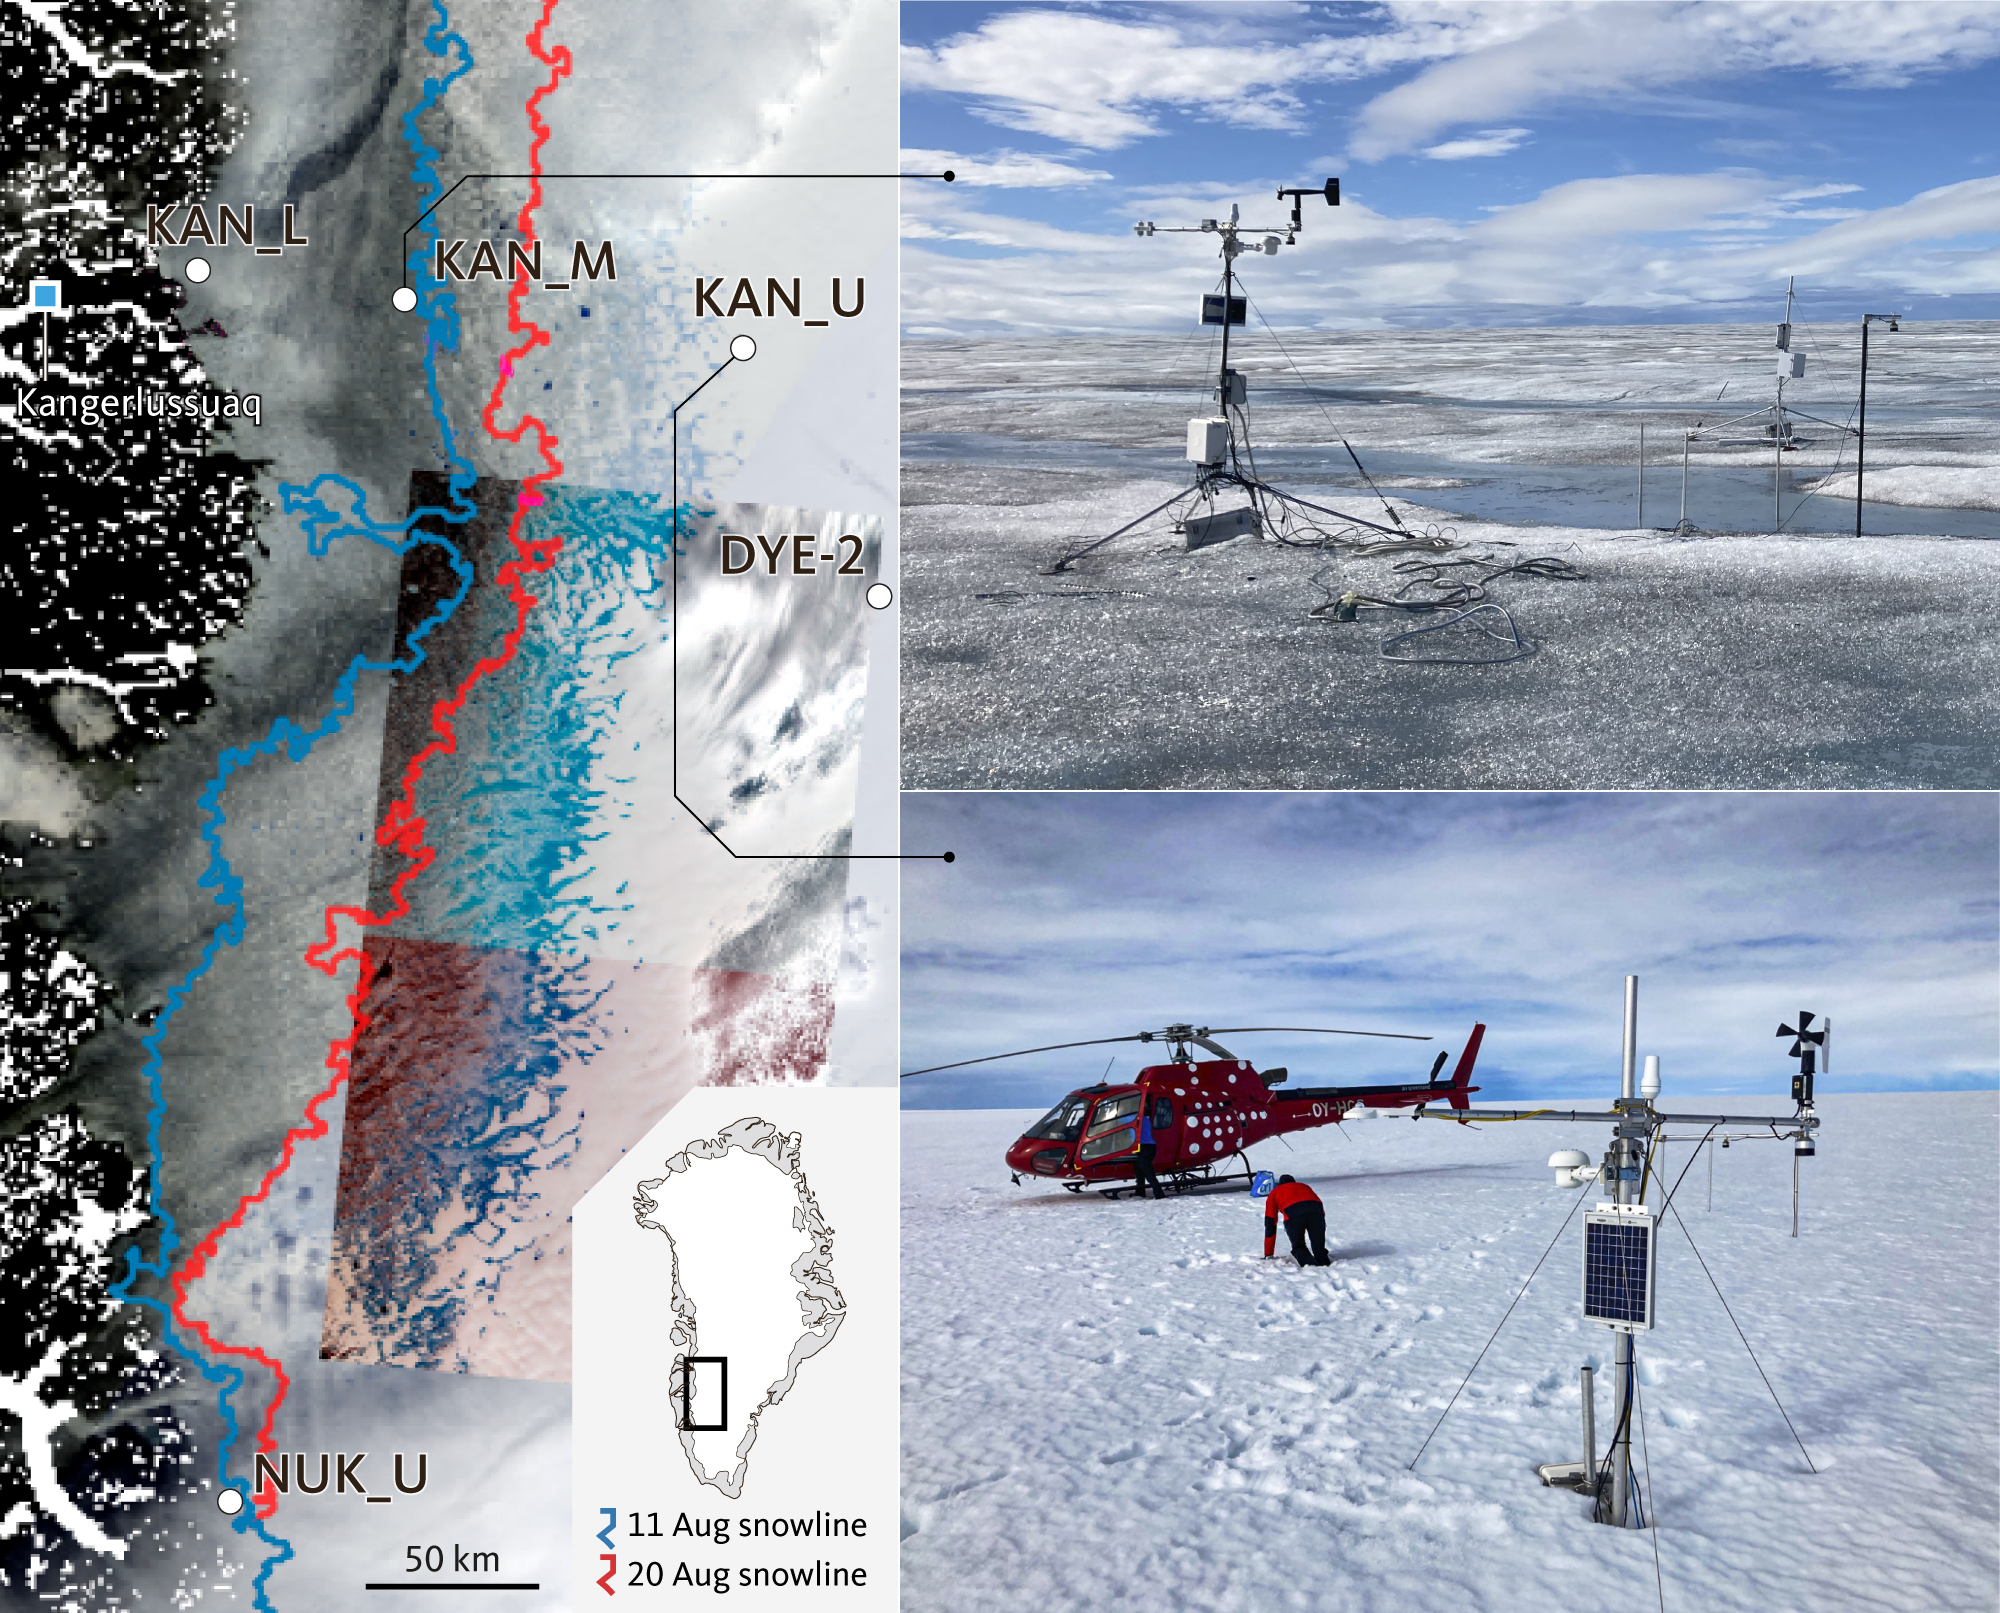
Photo: Maintaining a PROMICE automatic weather station on a small unnamed peripheral glacier in Southwest Greenland, near Nuuk. (W. Colgan/GEUS)

Overall, there is a large net melting of the ice in Greenland as a result of global warming, which is hitting harder here than in other regions of the world. But the picture is very complex and varied, he says:

“There are areas in East Greenland where more precipitation in the form of snow has balanced the ice mass loss, so that it is not nearly as large as in northern Greenland. Areas in East Greenland with mountains of over 2,000 metres have had increased precipitation in high-altitude areas,” says William Colgan.

However, this is offset by the proportionally very heavy melting from the peripheral glaciers in North Greenland in particular. Together, they now lose four times as much mass annually as in 2003, the new study shows.

The work is part of the continuos effort lead by GEUS monitoring the over all response to global climate change from the Arctic ice covers and consequential sea level rise.


Peripheral glaciers

In Greenland, there are many glaciers that are not connected to the Greenland Ice Sheet itself: 20,300 with a minimum area of ​​0.05 km2. They are found from the southernmost to the northernmost Greenland and range from large ice caps to small cirque glaciers, which are glaciers delimited to a depression in the terrain. All these glaciers have their own mass balance, just as the Greenland Ice Sheet has, i.e. the ratio between melting in summer and snowfall in winter. If the mass loss (melting) is greater than the mass supply (snowfall), the glacier becomes smaller, and vice versa. Compared to the Greenland Ice Sheet, there is relatively little research on the peripheral glaciers.

Historic Greenland ice sheet rainfall unraveled

For the first time ever recorded, in the late summer of 2021, rain fell on the high central region of the Greenland ice sheet. This extraordinary event was followed by the surface snow and ice melting rapidly. Researchers now understand exactly what went on in those fateful summer days and what we can learn from it. 


The never-before-seen rainfall, on 14 August 2021, made headlines around the world. The upper-most parts of Greenland’s enormous ice cap used to be too cold for anything other than snow to fall, but not anymore.

What caused this extreme event and how did it affect the ice? Researchers from the Department of Glaciology and Climate at the Geological Survey of Denmark and Greenland (GEUS) in collaboration with colleagues from France and Switzerland have since scrutinised these questions and come up with the answers.

It didn’t only rain at Summit Camp – rain was measured by new automatic weather stations placed across the ice sheet by GEUS’ ice-sheet monitoring projects Programme for Monitoring the Greenland Ice Sheet (PROMICE) and Greenland Climate Network (GC-Net).

Studying detailed data from these stations alongside measurements of surface reflectivity, or albedo, from the Copernicus Sentinel-3 satellite mission and information on atmospheric circulation patterns, the researchers discovered that the rain had been preceded by a heatwave at a time of year when seasonal melting is usually slowing down.

From the onset of the August heatwave in 2021, the surface of the ice sheet (here seen east of Kangerlussuaq) became notably darker due to melting snow, lowering the albedo and making it melt way more than expected for that time of year. (GIF: Edited by GEUS, images from Copernicus Sentinel-2, ESA)

It wasn’t the rain

“It turns out that the rain itself wasn’t the most important factor”, says Prof. Jason Box from GEUS and lead author of the paper reporting their results, which were just published in Geophysical Research Letters.

“There is an irony. It’s not really the rain that did the damage to the snow and ice, it’s the darkening effect of the meltwater and how the heat from the event erased snow that had overlaid darker ice across the lower third of the ice sheet.

“Unusually warm atmospheric rivers swept along Greenland in the late summer months, bringing potent melt conditions when the melt season was drawing to a close.”

In fact, this sudden increase of surface ice melt on Greenland could have happened without any rain ever touching the ground.

The main culprit was the heat itself, melting and completely removing the surface snow, thereby changing the surface albedo, Greek for ‘whiteness’, so that Greenland snow and ice absorbed more of the Sun’s rays.

The researchers found that, between 19 and 20 August 2021, this melt caused the altitude of the ice sheet’s snowline to retreat by a whopping 788 metres, exposing a wide area of dark bare ice (see below).

One of the areas of the ice sheet hit by the heat wave, causing the snowline to retreat immensely in a short period of time. This is along the PROMICE/GC-Net Kangerlussuaq transect of automatic weather stations (white dots) from where the researchers documented the very warm, wet ice and snow conditions during their field work. Usually the snow at KAN_U station is not this difficult to walk in during august. (Illustrations: GEUS, edited from Box et al. 2022 by C. Thuesen, photos Dirk van As).


Under normal circumstances, snow would cover and insulate this ice, but the snow melted suddenly and exposed the ice to heat, causing even more melting.

Since 2017, Prof. Box and colleagues have been consistently monitoring these melt dynamics with data from the Copernicus Sentinel-3 mission as part of their research supported by ESA’s Earth Observation Science for Society programme.

They found that more bare ice had been exposed on the one day of 19–20 August than any other day since their research began (see below).

Area of bare ice measured from 2017 to 2021, where the heatwave in 2021 greatly increases bare ice extent very late in the melt season. (Illustration: Edited from Box et al. 2022 by C. Thuesen, GEUS)

So, what does this mean?

The authors conclude that the heatwave causing the rain event serves as an excellent example of ‘melt-albedo feedback that amplifies the melt impact of the initial melt perturbation’.

Besides the obvious concern of making the ice sheet melt faster while this was happening, studying the event using detailed measurements from the network of automatic weather stations on the ice set up by GEUS coupled with measurements from the Copernicus Sentinel-3 satellites helps understand the exact processes and dynamics of how ice melts.

Even though the rainfall was a shock and a milestone in climate history, researchers knew it was bound to happen sooner or later, given the rising temperatures of the Arctic.

Therefore, Prof. Box and the co-authors encourage research to look further into the workings behind atmospheric rivers and not just rainfall.

They conclude that understanding the frequency of heatwaves, appears to be a more significant research target than the liquid precipitation that heatwaves may or may not produce.

The study explained by Prof. Jason Box


The 2021 august melt event

  • The ‘atmospheric river’ heat wave causing the rain event in mid-August 2021 was the actual cause of the following surface melt, not the rain itself.
  • The heat wave caused extensive melting to happen unusually late in the season.
  • The melt event caused the snow line to elevate by an extreme amount (788 m), exposing a wide area of dark bare ice.
  • The ice sheet had more than four days of wet snow cover in August which is double the normal amount.
  • The Watson River rose abruptly to record high values for that late part of the melt season, demonstrating independently the off-ice impacts of the heatwave in increasing meltwater delivery into the ocean, rising sea level.

Read the paper

The Mid-August 2021 Greenland Ice Sheet Heatwave with Rainfall: Extreme Melting Sustained by Albedo Feedback (DOI:10.1029/2021GL097356) published in Geophysical Research Letters.

Authors and institutions:

  • Jason E. Box, Dirk van As, Robert S. Fausto, Kristian K. Kjeldsen, Armin Dachauer, Andreas P. Ahlstrøm, the Geological Survey of Denmark and Greenland (GEUS), Copenhagen, Denmark
  • Adrien Wehrlé, Institute of Geography, University of Zurich, Zurich, Switzerland
  • Ghislain Picard Geological Survey of Denmark and Greenland (GEUS), Copenhagen, Denmark and UGA, CNRS, Institut des Géosciences de l’Environnement (IGE), UMR 5001, 8 38041 Grenoble, France