For the 26th year in a row, the Greenland Ice Sheet is shrinking
Every year in September, the annual melting season in Greenland is over, and glaciologists from GEUS take stock of the past 12 months’ ‘budget’ for the Greenland Ice Sheet and calculate whether the sheet has, overall, become bigger or smaller. This year, once again, it is unfortunately the latter.
In this melting year, much more ice has disappeared from the Greenland Ice Sheet than has formed, and it is the 26th year in a row that this is the case. In total, the ice sheet has lost approximately 84 billion tons of ice since last season. These are, of course, huge quantities, but they are still at the lower end of what has been the norm over the past few decades, with a general increase in melting. This is according to Chief Consultant and Glaciologist Andreas Ahlstrøm from the Geological Survey of Denmark and Greenland (GEUS).
“The melting of the Greenland Ice Sheet in the melting year 2021 to 2022 has raised the water level in the world’s oceans by approximately 0.2 millimetres. So even though it’s less than we’ve seen in the past, it’s still contributing to the growing problem,” he says. Last melting year, for instance, the ice sheet lost 172 billion tons of ice, which corresponds to almost half a millimetre of global sea level rise (see graph for sea level rise below article)
The amount of ice melting in a year is partly determined by natural variation, but since 1997, the Greenland Ice Sheet has lost mass every year. The record so far is the melting year 2011 to 2012 with approx. 460 million tons of ice, i.e. approximately five times more than this year (see accumulated mass loss since 1986 below article).
The European heatwave helped
In fact, the extremely hot summer in Europe may have contributed to the fact that this year there was a little less melting than usual, explains Andreas Ahlstrøm:
“We often see that heat waves in Europe bring about the opposite in Greenland, which tends to experience colder weather than usual during these periods. This can lead to less melting.”
As the climate globally gets warmer, scientists expect more heat extremes like those that hit Europe this year. Some years they will hit Europe, other years, it will be Greenland and the Greenland Ice Sheet or a third place.
Researchers at GEUS make the annual status of the ice sheet’s so-called mass balance, when the ice has gone through a winter season and a subsequent melting season. This is called a hydrological year or a ‘melt year’, and it runs from September to August. You can also calculate the mass balance of the ice in ordinary calendar years, but in that case, the calculation will consist of two half winter seasons and a summer season as opposed to one total winter season and subsequent summer season.
The dividing line for a hydrological year is set on September 1st because that is approximately when the ice usually enters the winter season; when it begins to build up mass again rather than losing it.
Weather stations monitor ‘the pulse of the ice’
We only know whether ice is added to or lost from the Greenland Ice Sheet over the course of a year, because a lot of people ‘check the pulse of the patient’ on a daily basis and have done so for many years.
It quite simply depends on how much it snows compared to how much ice melts and breaks off as icebergs. And that requires a lot of data on where the ice formation and melting take place, as well as how and why.
This is the why GEUS leads a large monitoring program on the melting and dynamics of the Greenland Ice Sheet, which consists of two sister projects: Greenland Climate Network (GC-Net) and Program for Monitoring of the Greenland Ice Sheet (PROMICE).
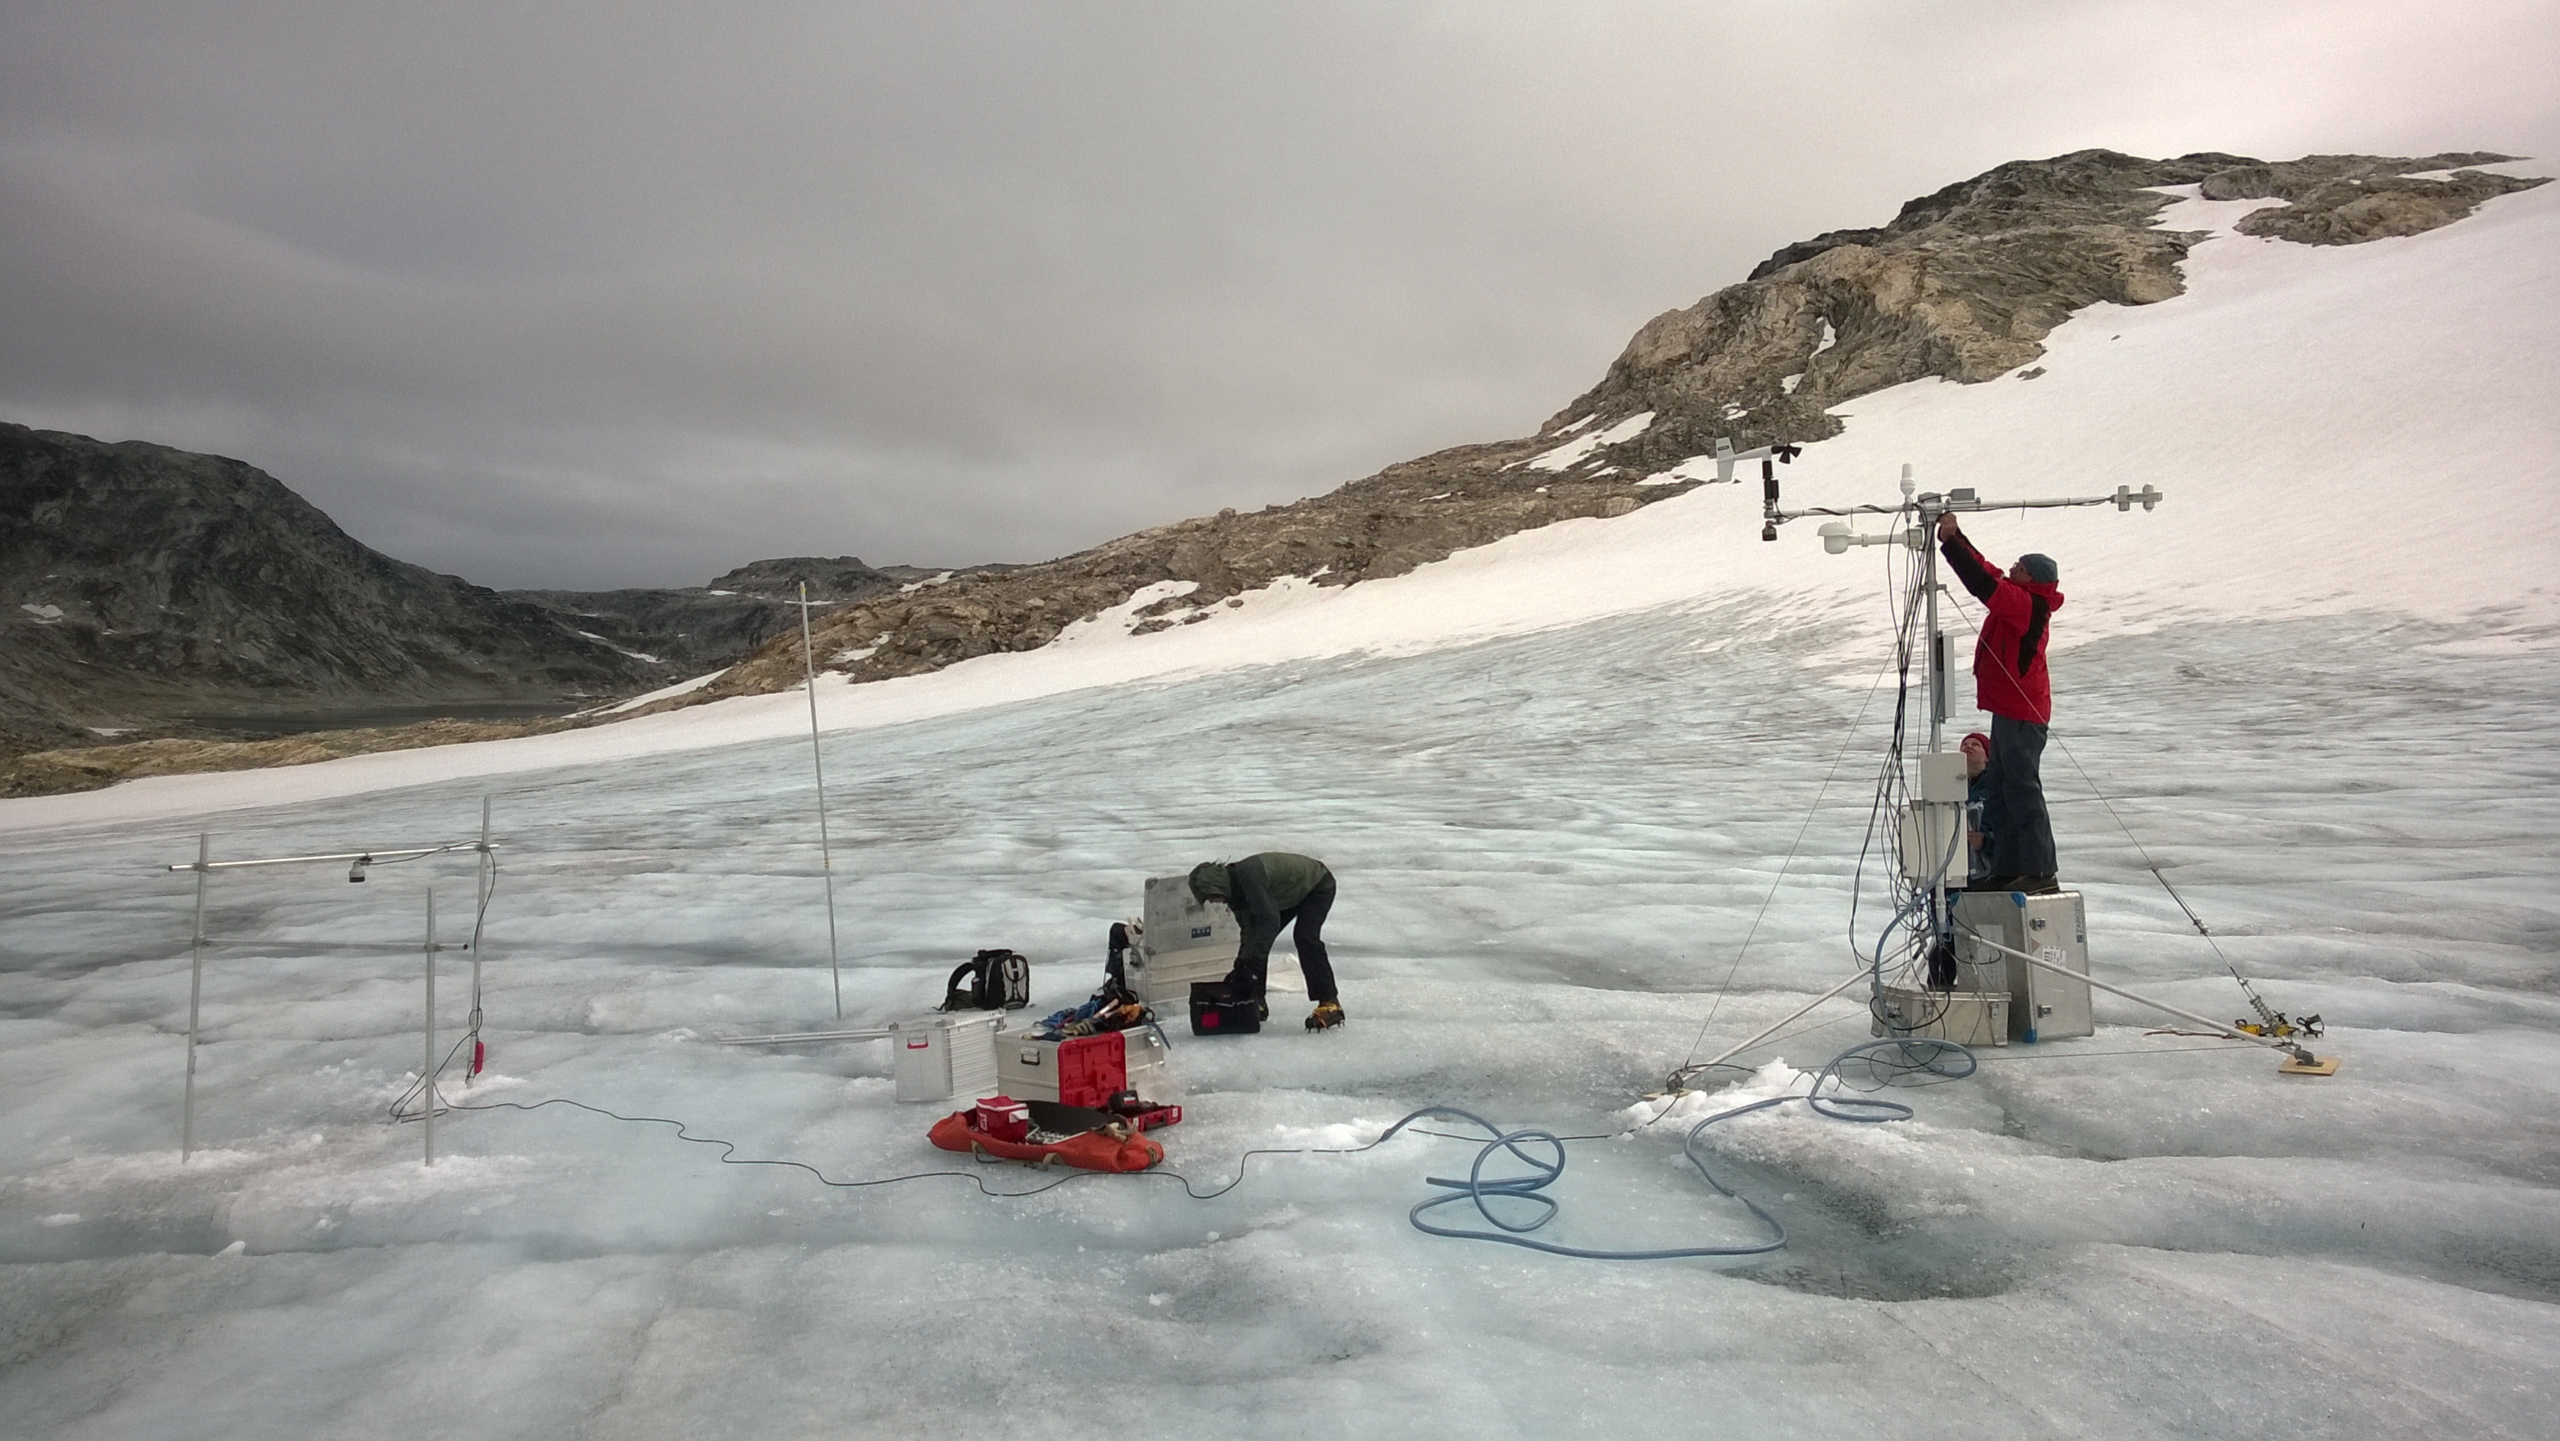
Photo: Maintaining a PROMICE automatic weather station on a small unnamed peripheral glacier in Southwest Greenland, near Nuuk. (W. Colgan/GEUS)
GEUS has more than 40 automatic weather stations located all over the Greenland Ice Sheet and connects measurements from them with satellite measurements and field observations. The data is linked with climate models from e.g. DMI, and with that data, both the daily and annual melting from the ice is calculated.
GEUS continuously develops the weather stations to keep up with the rapid development of the Arctic climate. Every spring and summer, the researchers spend many days on the Greenland Ice Sheet, traveling around and inspecting the precious equipment. The measurements are used by many researchers worldwide, and they are included in the IPCC’s status reports on climate change and its effects.
For several weeks in May 2022, Andreas Ahlstrøm was on the ice with a team of GEUS colleagues to monitor and update weather stations along the north-eastern flank of the Ice Sheet.
“For instance, we have put rain gauges on our weather stations so that we can monitor the influence on the ice by the still more frequent Arctic rains,” he says.
See our data for accumulated mass loss and sea level rise below (click on graph for full size view).