Now we know how much ice will melt from Greenland at the very least
Based on two decades worth of measurements instead of models, glaciologists have for the first time determined the minimum ice loss committed from the Greenland Ice Sheet as from the climate warming so-far. This leaves out the uncertainty of any positive or negative future climate scenario, letting us know the absolute lower bound for what’s to come.
Note: This article has been edited in order to correct an error in mass loss; originally the article stated a mass loss of 110 quadrillion tonnes, the correct number is 110 trillion tonnes.
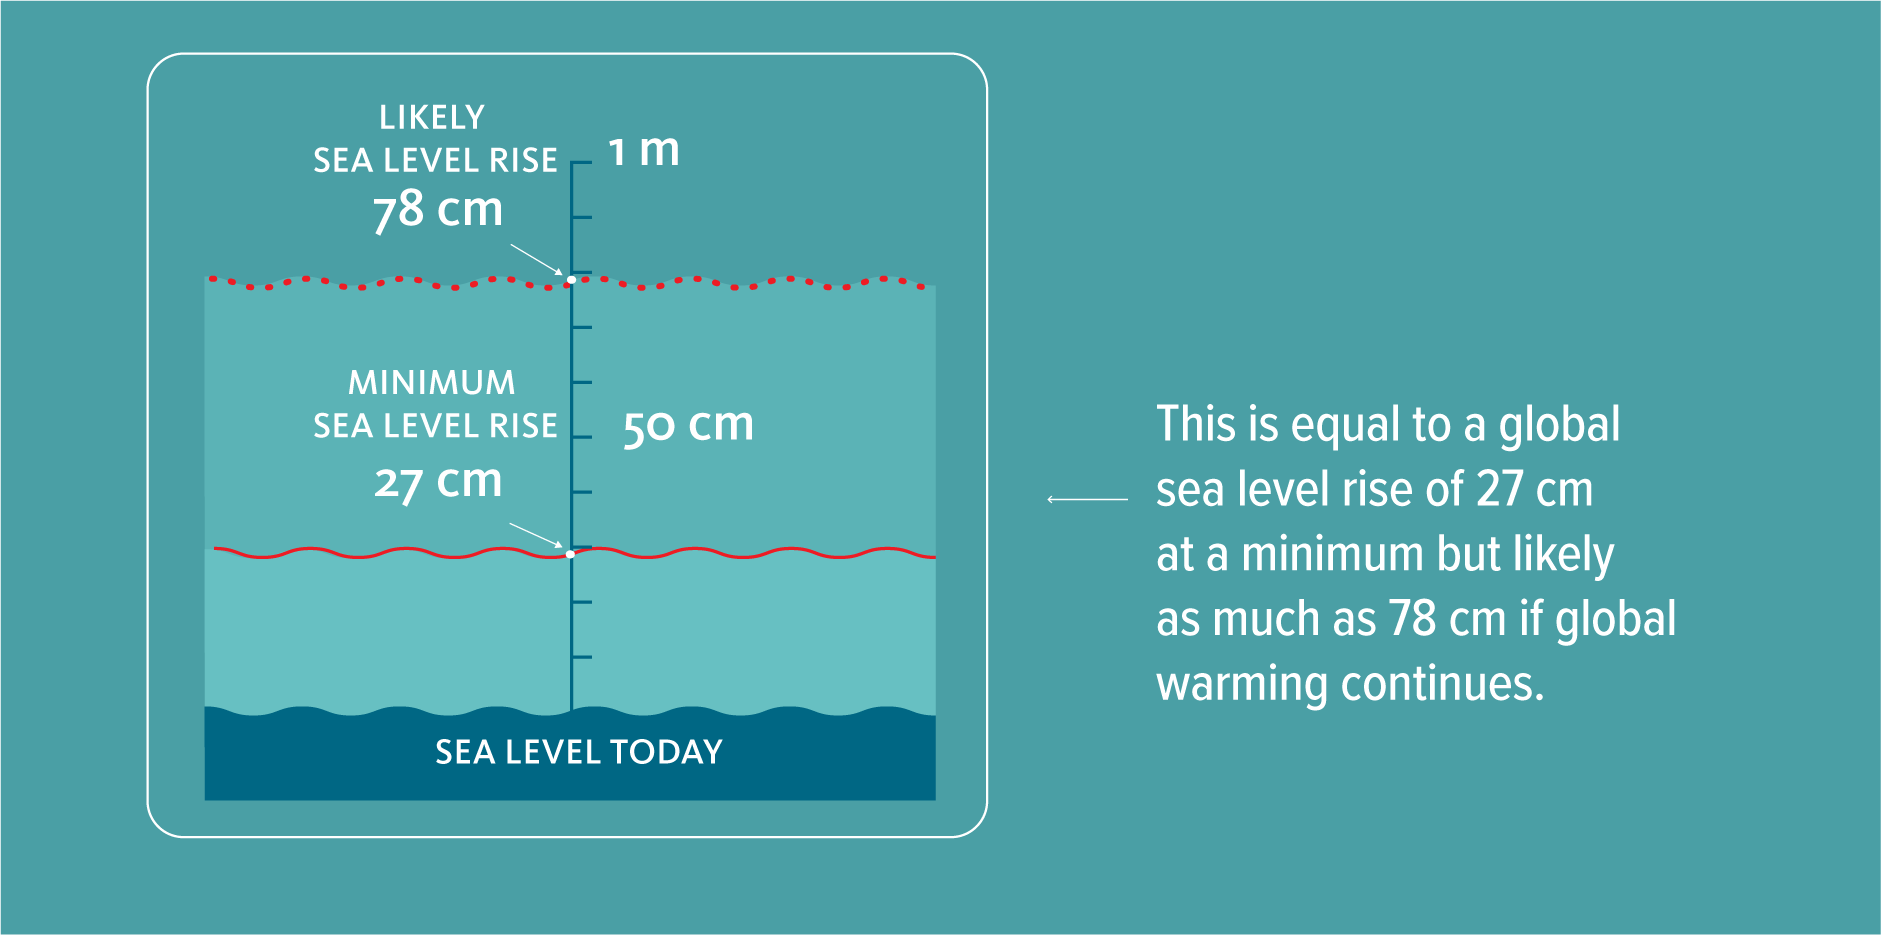
Even if the whole world stopped burning fossil fuels today, the Greenland Ice Sheet would still lose about 110 trillion tonnes of ice leading to an average of global sea level rise of at least 27 centimetres.
By looking at the climate in the Arctic from 2000 to 2019 and the imbalance it has created in the Greenland Ice Sheet, researchers have calculated that the shape of the ice is set in motion to correct this imbalance – inevitably – by losing 3.3 percent of its current volume, which corresponds to the numbers mentioned.
Actually, this is a low estimate according to the lead author on the study just published in Nature Climate Change, Professor Jason Box from the National Geological Survey of Denmark and Greenland (GEUS).
“It is a very conservative rock-bottom minimum. Realistically, we will see this figure more than double within this century,” he says and elaborates:
“In the foreseeable scenario that global warming will only continue, the contribution of the Greenland Ice Sheet to sea level rise will only continue increasing. When we take the extreme melt year 2012 and take it as a hypothetical average constant climate later this century, the committed mass loss from the Greenland Ice Sheet more than doubles to 78 cm.”
Notably, this study is only looking at the situation of the Greenland Ice Sheet, not considering the mass loss from Antarctica or other glaciers around the world.
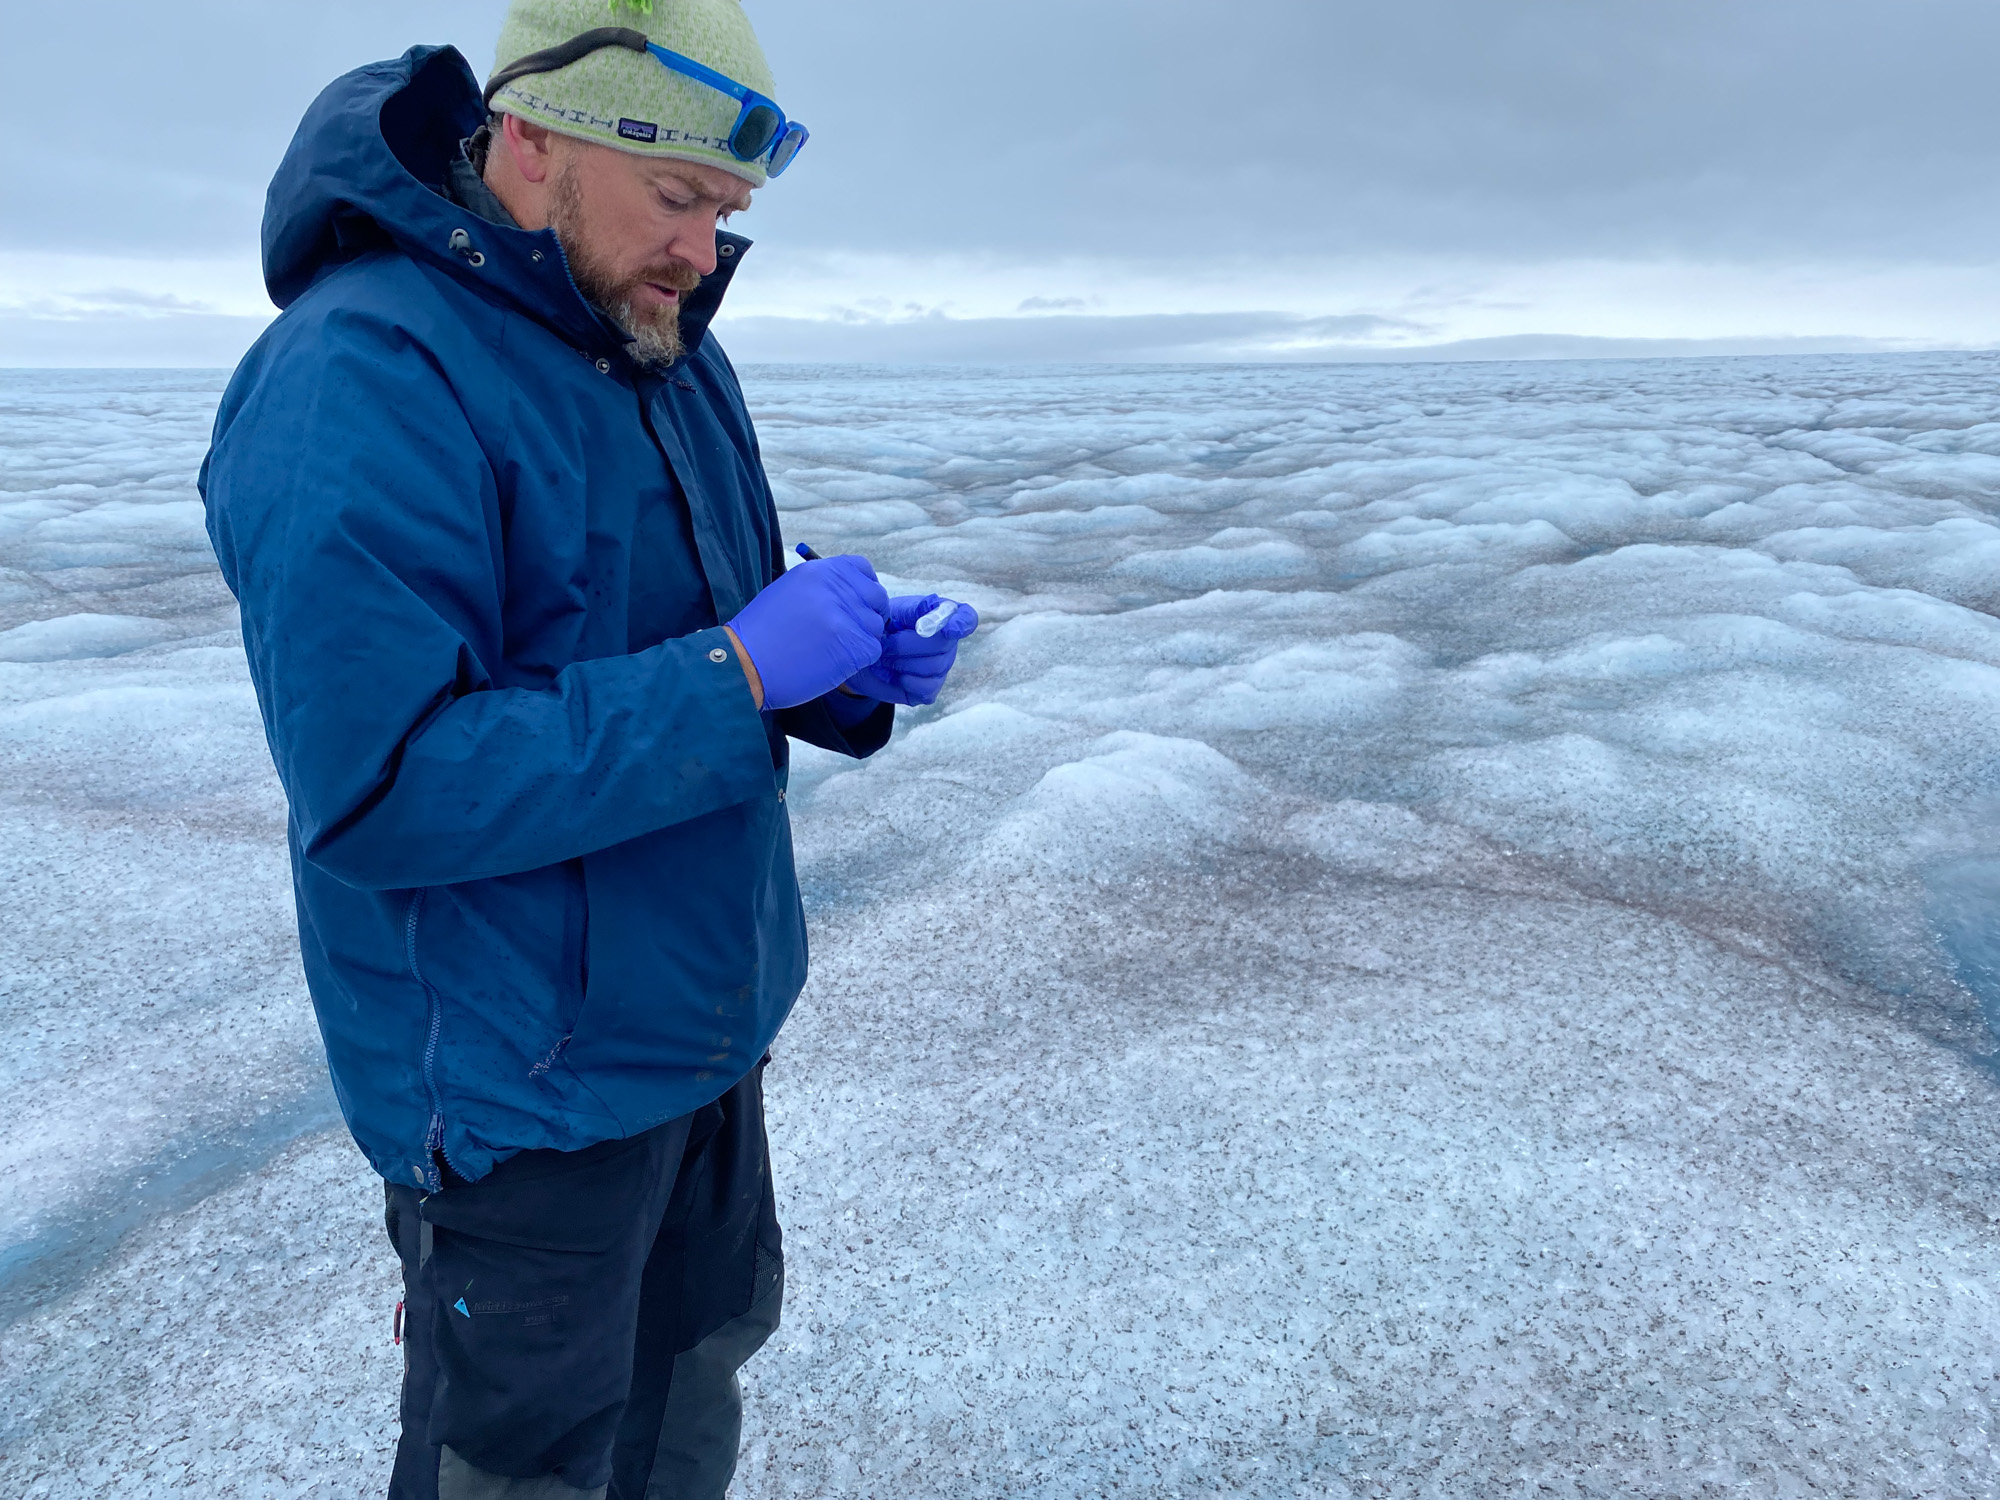
Professor Jason Box from GEUS taking ice samples standing on exposed ice below the snow line of the Greenland Ice Sheet in West Greenland during the melt season (credit: The Geological Survey of Denmark and Greenland, GEUS)
Ice models cannot keep up
It is a complete novelty for researchers to be able to put a minimum figure on the melting from the Greenland Ice Sheet in this manner. A figure that does not depend on highly uncertain computer models of the ice flow and climate interaction but on actual measurements of the ice obtained with satellites and the researchers’ own observations over the last two decades.
Now there’s enough data points to see that the balance in the last two decades worth of annual addition and loss of mass from the ice sheet simply ‘requires’ the ice to lose at least three percent of its mass to the ocean. Otherwise, the physics don’t add up.
This radically different method has already raised some eyebrows in the science community by the mere rumour preceding the actual publication of the scientific paper, Professor Box says. He stresses, that this new way of doing things is of the utmost importance.
“The ice flow models are not ready in this area. This is a complimentary way of calculating mass loss that has been lacking,” says Professor Box. He emphasizes that the downside to this method is that it does not give a timeframe.
“In order to get the figure that we have, we had to let go of the time factor in the calculation. But our observations suggest that most of the committed sea level rise will occur this century.”
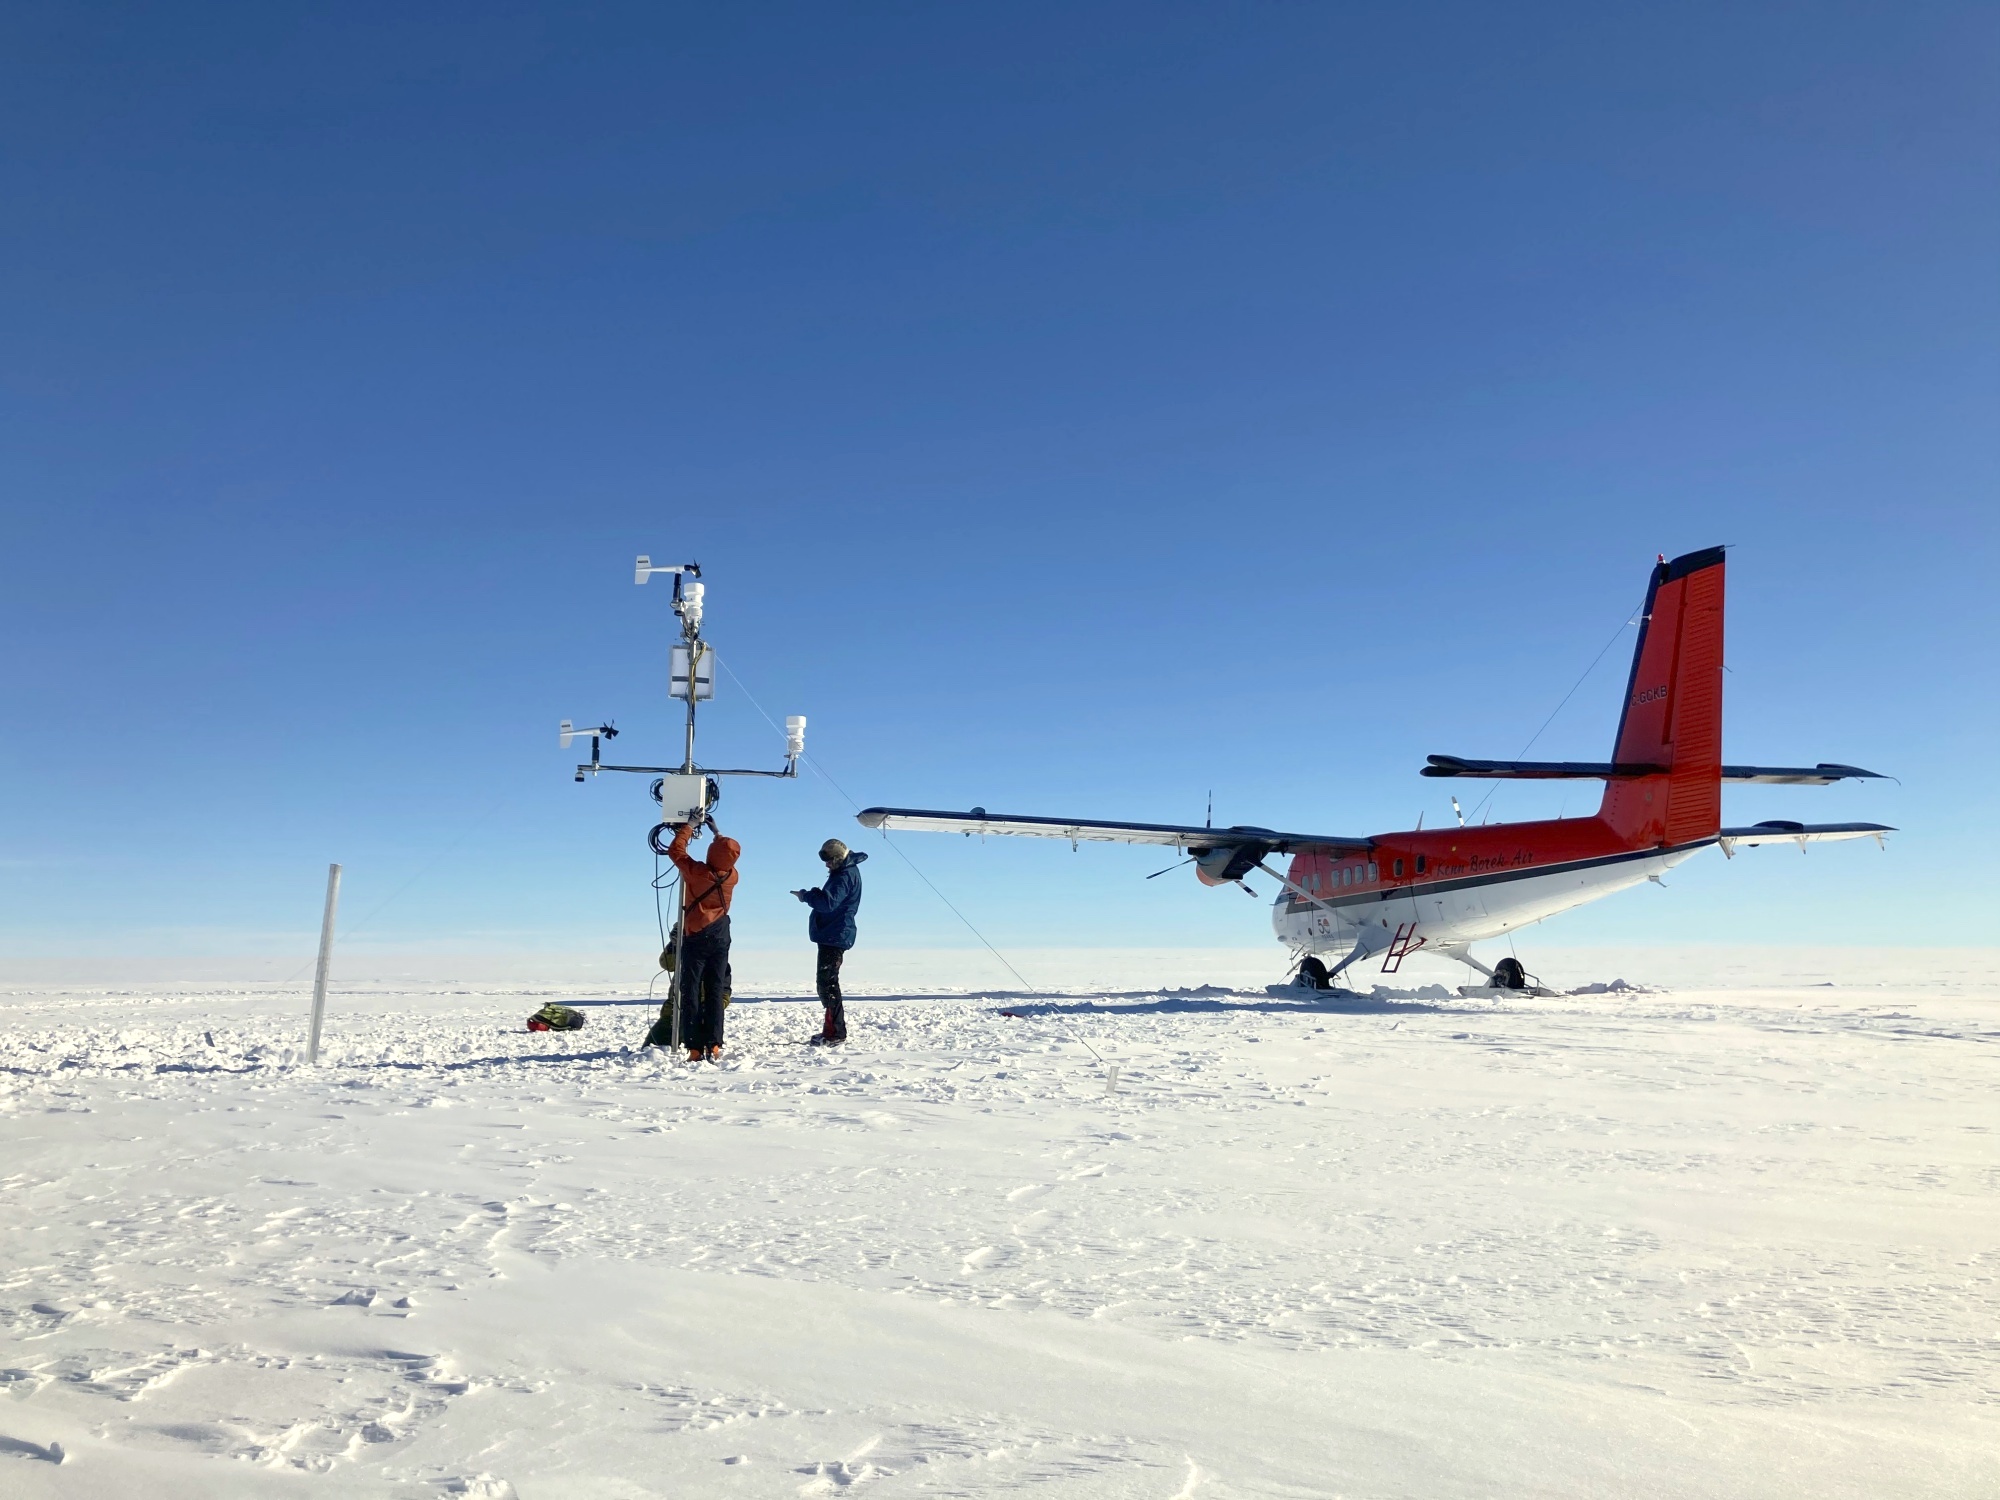
The GEUS glaciologist team setting up one of many automatic weather stations on the snowy surface above the snow line in order to follow the changing dynamics (credit: The Geological Survey of Denmark and Greenland, GEUS)
How did they do it?
The researchers have looked at changes in the so-called snow line of the ice sheet – the boundary between areas of the ice sheet that are exposed to net melting during summer and the areas that are not. The ice does not melt equally all over the surface but primarily along the edges at the warmer lower elevations. Further up the ice sheet, it is too cold for net surface melting to occur even in summer. The boundary between melting and no melting, the snow line, is set by the line where the upper layer of winter snow does not melt away in summer but remains on top, nourishing the ice sheet.
The snow line varies from one year to the next, depending on the weather conditions. A hot summer may mean that the boundary moves further up the ice sheet, thus increasing the melt area and with it the amount of ice melting from the surface that year. In colder years, the melt area can decrease, pushing the snow line down towards the ice edges allowing less mass to be lost.
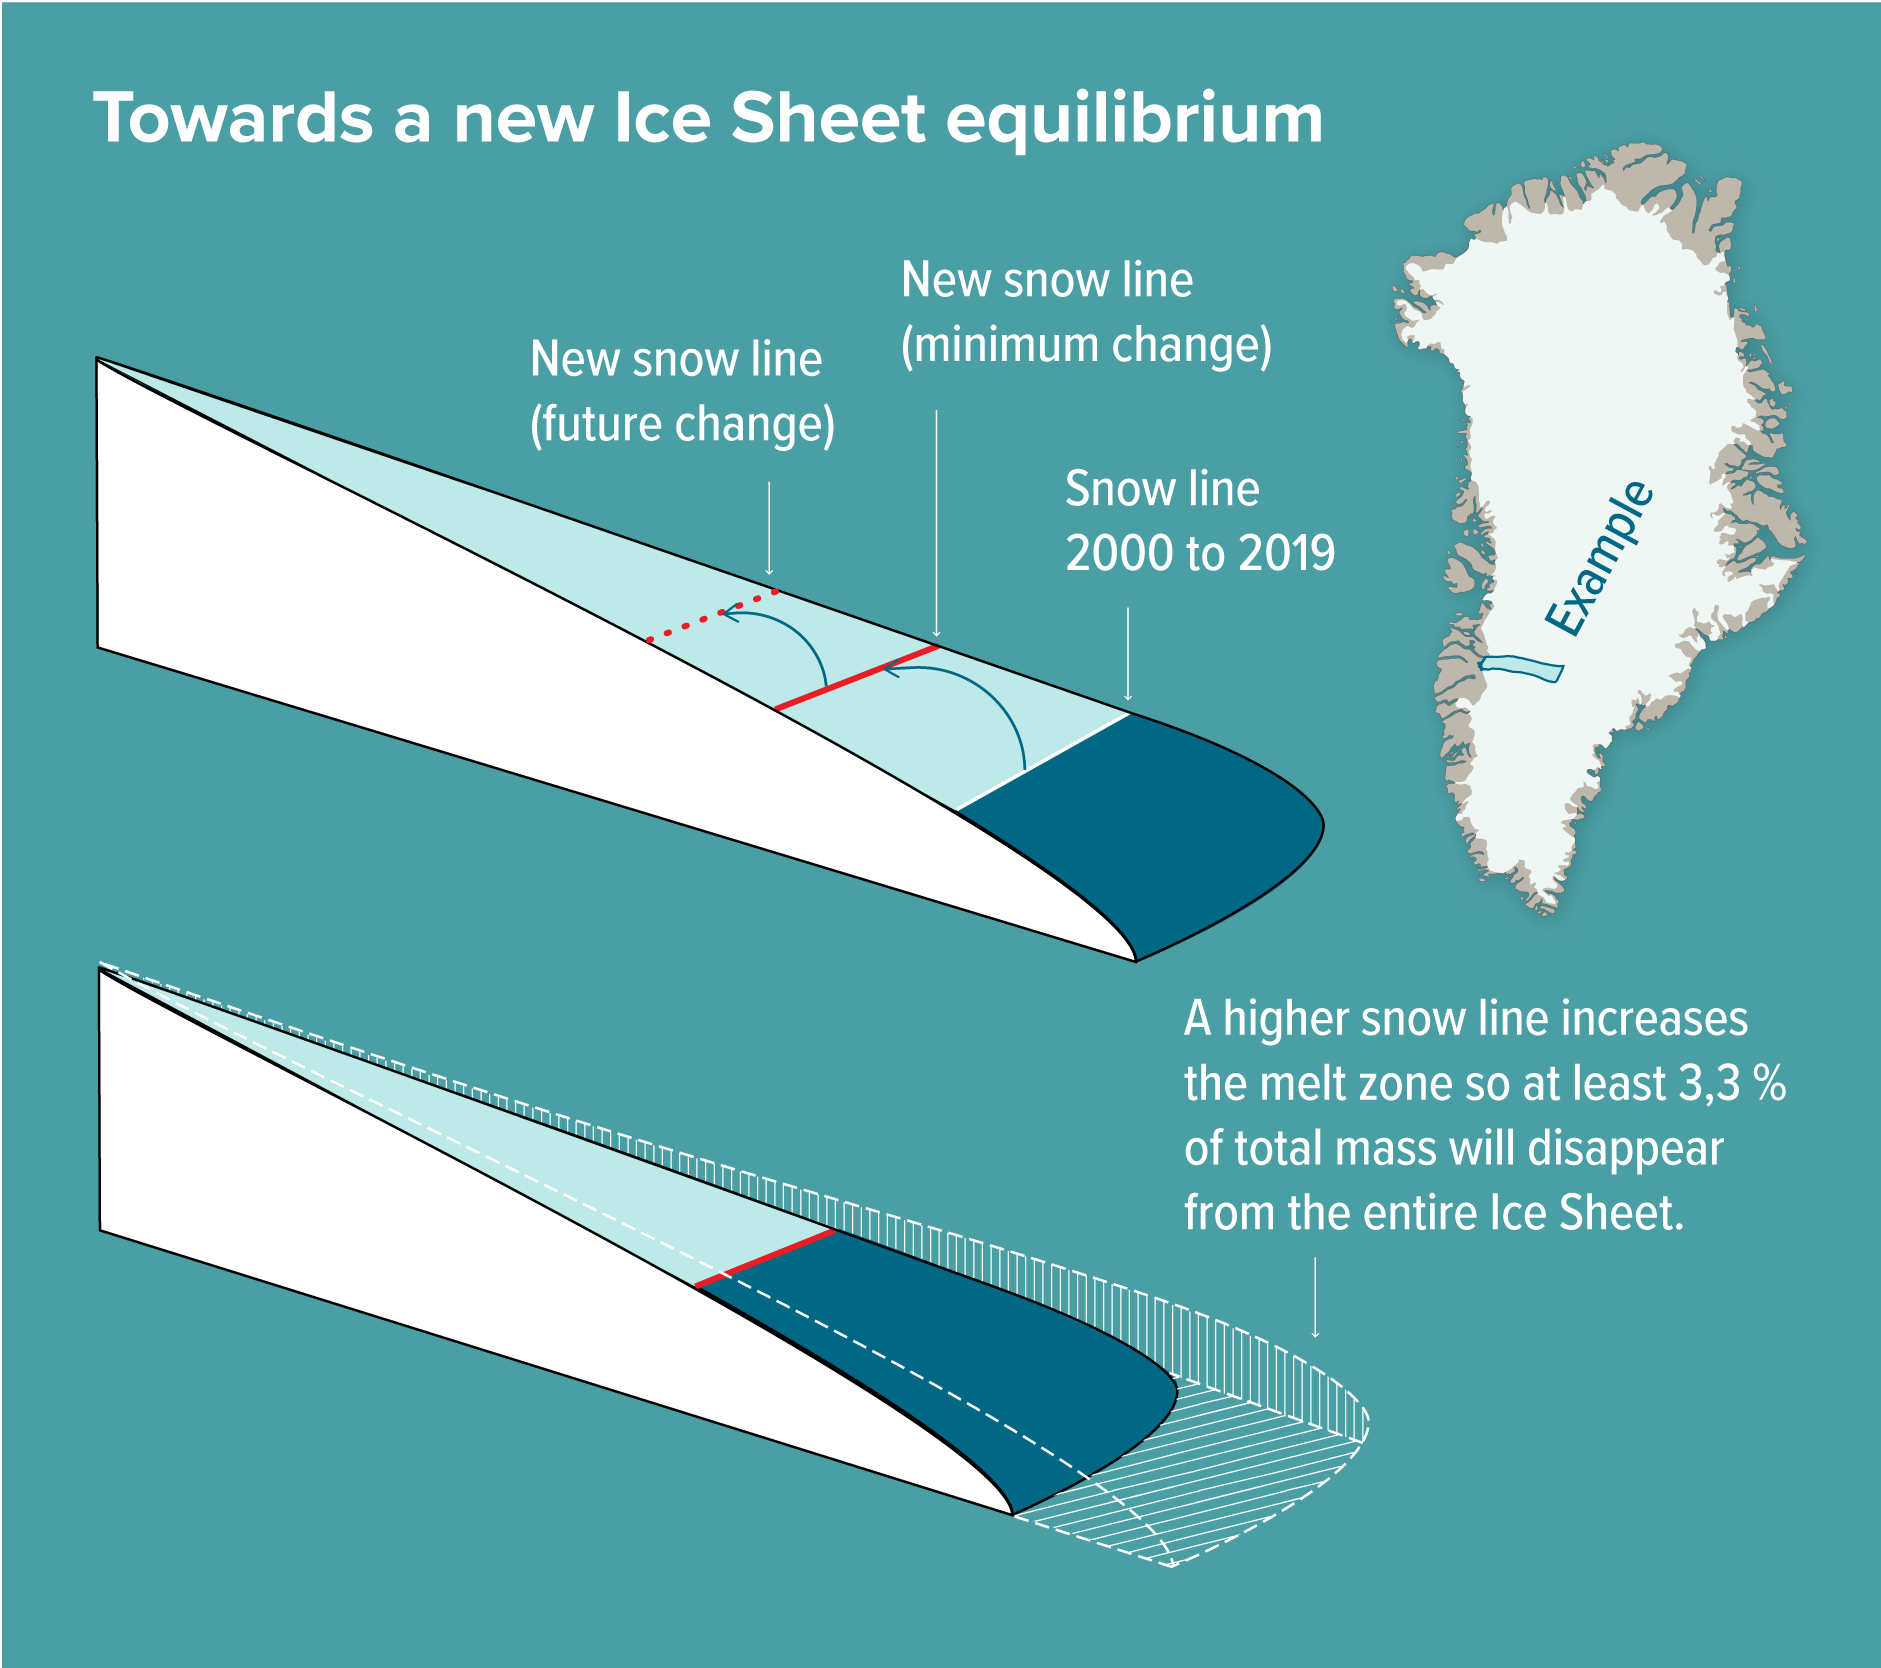
In the recent (2000–2019) climate, the Greenland ice has built up a disequilibrium which will inevitably correct itself by reducing total mass by at least 3.3 percent in order to regain equilibrium at a new average snow line in a higher alteration. (credit: The Geological Survey of Denmark and Greenland, GEUS)
The snow falling on the ice during winter turns into new ice over time. If the snow does not melt away during summer, that is. In order for the ice sheet to be in equilibrium, the added mass must equal the lost mass. In a stable climate, that’s the case. If a hot summer causes the layers of snow to be lost by melt, that snow will be missing in the mass budget for years to come, creating a mass budget deficit or disequilibrium.
It is this disequilibrium Professor Box and colleagues has calculated the consequence of based on more than a decade of research. Using a rigorous glaciological theory abiding the physics of ice flow based on measurements from satellites and other observations, they calculated the average snow line needed to bring the ice sheet back into balance. This average snowline increases the melt area resulting in increased imbalance and ultimately a slower alteration of the shape of the ice sheet. Now equivalent with losing an absolute minimum of 3.3 percent of total volume, equal to 110 trillion tonnes of ice or a sea level rise of 27 cm.
As a lower bound, the Greenland Ice Sheet is committed to lose 3.3 % of current mass possibly within this century. This corresponds to:
- 110 trillion tonnes of ice (110,000,000,000,000 tonnes)
- Covering the entire United States with 11 meters of water (37 feet)